
Networking giant Cisco Systems, Inc. (CSCO) has witnessed a decent run on the share market, with its stock gaining more than 10% over the past three months. Further bolstering its position is the staunch backing from institutional investors who hold a commanding 75% stake in the company.
Moreover, the company’s prospects have been further endorsed by J.P. Morgan analyst Samik Chatterjee who raised his rating on Cisco’s stock from Neutral to Overweight, augmenting his price target from $55 to $62. This upgrade comes on the heels of orders showing signs of bottoming.
Chatterjee commented, “We expect the macro [economy] to continue to drive spending sluggishness from customers, but at the same time, we expect demand/orders for networking equipment, including Wi-Fi, campus switching, and datacenter switching, to have limited further deterioration.”
With a robust foothold in the networking industry, CSCO stands to substantially benefit from rapidly evolving technologies such as cloud computing, artificial intelligence, and the Internet of Things. The demand for fast and reliable network connectivity is escalating as these technologies gain traction.
The global router and switch market, the sector in which CSCO is a leading player, is expected to grow at a CAGR of 6.3% from 2023 to 2030.
To comprehend why adding CSCO to your investment portfolio could be rewarding, let’s delve deeper into some of the company’s key metrics.
Analyzing CSCO’s Financial Performance from 2020 to 2023
The trailing-12-month net income of CSCO has shown a general upward trend between October 2020 and April 2023, albeit with some fluctuations. Here’s an overview:
- In October 2020, the net income was $10.46 billion.
- By January 2021, it declined slightly to $10.13 billion.
- This was followed by marginal growth in May 2021, with the net income at $10.22 billion.
- In July 2021, there was an upward swing as the net income rose to $10.59 billion.
- This trend continued through October 2021, with a steeper rise to $11.40 billion and then again to $11.83 billion in January 2022.
- After reaching a peak in April 2022 at $12.01 billion, the net income experienced consecutive declines. It fell to $11.81 billion in July 2022, $11.50 billion in October 2022, and finally to $11.30 billion in January 2023.
- However, a slight recovery was noticed in April 2023, with the net income growing marginally to $11.47 billion.
This signifies an increase of approximately 9.58% since the start of the period in October 2020.

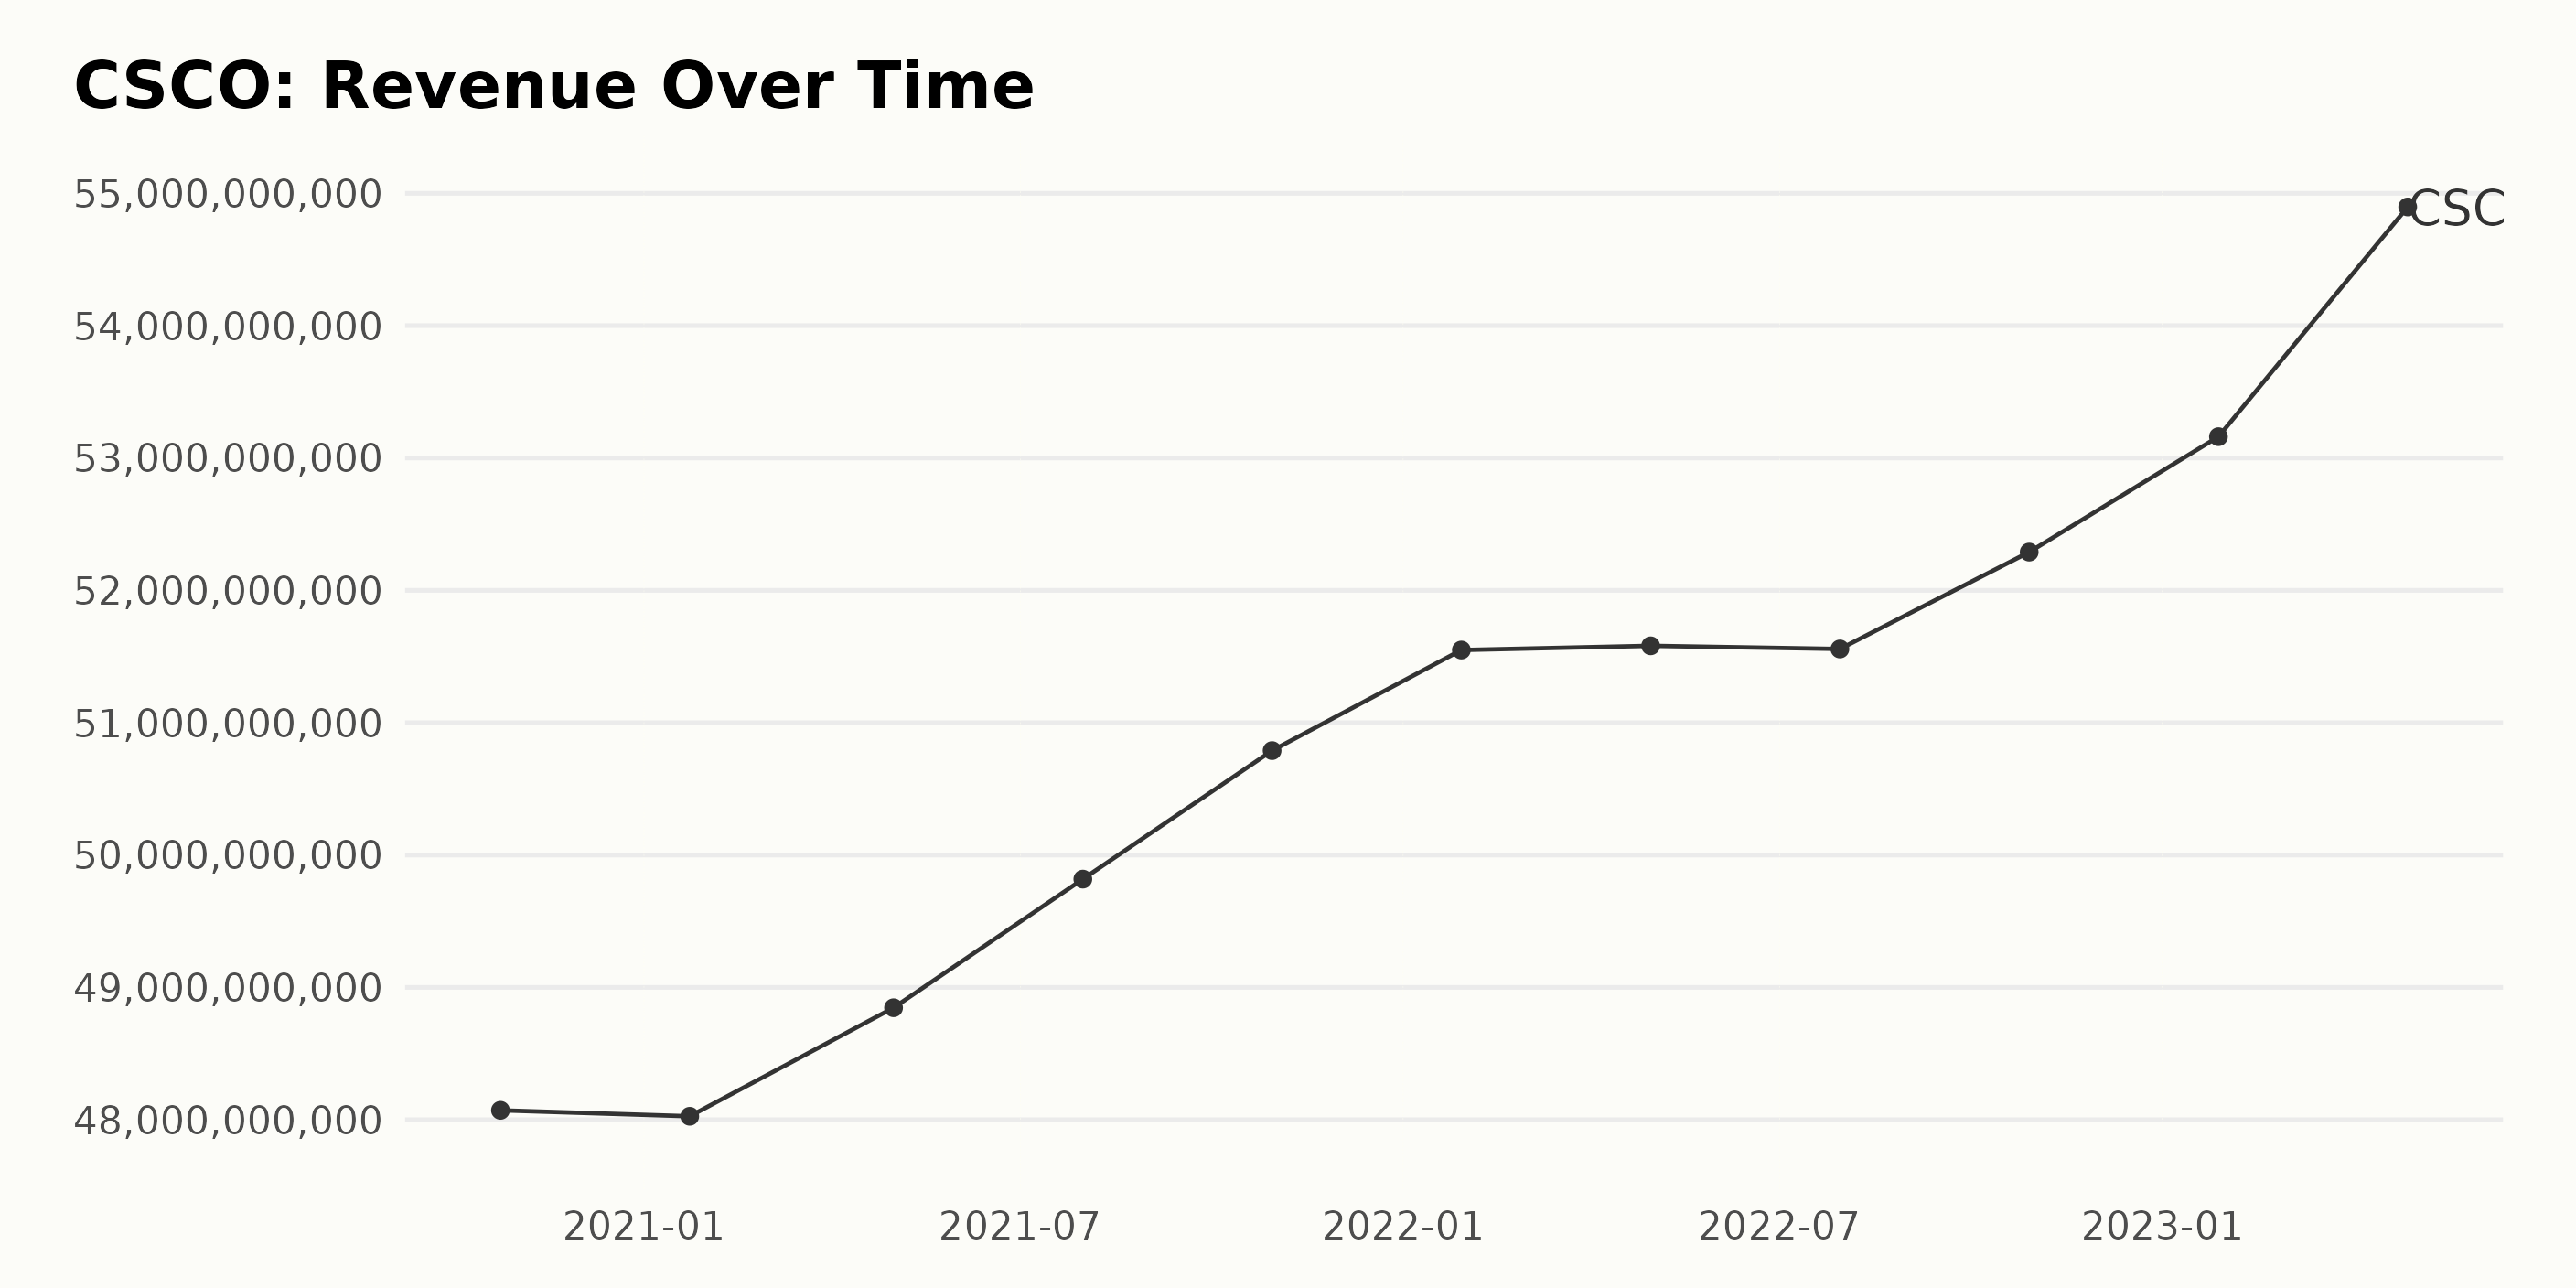
The trailing-12-month revenue trend and fluctuations for CSCO over the mentioned data series reveal a generally positive trend with elements of stability. Key Highlights:
- The revenue in October 2020 was $48.07 billion.
- There was a minor dip in January 2021 at $48.03 billion, steadily increasing to $48.85 billion by May 2021.
- By July 2021, revenue experienced a more significant upward shift, reaching $49.82 billion.
- This positive growth trend continued through 2021 and into 2022, with revenue reaching $51.58 billion by July 2022.
- However, the growth rate seemed to stabilize across April to July 2022, with revenue fluctuating minimally between $51.58 billion and $51.57 billion.
- The reported company’s revenue resumed upward after July 2022, rising to $52.29 billion by October 2022, then leaping to $53.16 billion by January 2023.
- The most substantial increase within the reviewed period occurred around April 2023, when the revenue jumped notably to $54.90 billion.
The latest value in the data series is $54.90 billion in April 2023, indicating a solid positive growth rate compared to the first value reported in October 2020 at $48.07 billion. Overall, this denotes a good financial performance of CSCO in terms of its revenue.
The following summary describes the trend and fluctuations in the Return on Invested Capital (ROIC) of CSCO based on the series of data provided:
- The data starts with an ROIC value of 0.362 in October 2020 and ends at 0.506 in April 2023.
- Over the period of approximately two-and-a-half years, the trend is an overall increase in ROIC. The growth rate from the initial value of October 2020 to the final value of April 2023 is approximately 40%.
- While the overwhelming majority of the values reflect an upward trend, there is one instance where the value sees a minute drop. This occurred between April 2022 and July 2022, when the ROIC decreased from 0.483 to 0.480. However, this appears to be a minor fluctuation in an otherwise consistent upward trend.
- The latest ROIC value, as of April 2023, stands at 0.506, which is its highest over the observed period.
Given the consistency of the upward trend, barring negligible drops, the ROIC of CSCO demonstrates strong performance, with increasing efficiency in generating returns from its capital investments, as indicated by the latest ROIC figure of 0.506.

The Dividend per Share (DPS) of CSCO has shown a steady trend with slight fluctuations over the observed duration, from October 24, 2020, to April 29, 2023.
- On October 24, 2020, the DPS of CSCO started at $1.43.
- Gradual quarterly increments were observed: January 23, 2021, witnessed a rise to $1.44, followed by an increase to $1.45 on May 1, 2021.
- This trend persisted through 2022 and 2023 with slight growth every quarter, reaching $1.46 in July 2021, $1.47 in October 2021, $1.48 in January 2022, $1.49 in April 2022, $1.50 in July 2022, and then $1.51 in October 2022.
- The latest recorded value was $1.53 on April 29, 2023.
By examining the change from the first value ($1.43) to the last value ($1.53), we find an approximate growth rate of 7% over the period. The continuous incremental trend indicates a stable growth strategy by CSCO in terms of dividends, emphasizing recent growth to $1.53 being significant.

Analyzing CSCO’s Share Price Trends from February to July 2023
Analyzing the provided data makes it clear that there are some definitive trends in the share price of CSCO over the period from February to July 2023.
- In February 2023, the share price started at $48.97 and dropped slightly to $47.28 by mid-month. It gradually rose back by the end of the month to around $49.19.
- March 2023 saw a gradual rise in share price, with the month starting at $48.64 and ending at a significantly higher value of $51.09.
- In April 2023, the shares of CSCO experienced a clear downward trend, falling from a high of $51.8 at the beginning of the month to a low of $46.88 by the end of the month.
- The following month, May 2023, saw the trend reversing, with prices initially stabilizing around $46, then beginning an upward trend later in the month, ending around $49 at the close of May.
- June 2023 appeared to present a stable period for the shares, with smaller fluctuations as the share price increased, peaking at $51.15 by mid-June and maintaining that general level through the end of June and into July.
- The share price continued a moderate climb in July 2023, ending the month at a relatively high value of $52.04.
Here is a chart of CSCO’s price over the past 180 days.

Analyzing CSCO’s POWR Ratings: Quality and Stability Trends
CSCO has an overall B rating, translating to a Buy in our POWR Ratings system. It has an A grade in Quality and a B in Stability. CSCO is ranked #5 out of the 53 stocks in the Technology - Communication/Networking category.
The two most noteworthy dimensions for CSCO based on the POWR Ratings are Quality and Stability. Here is a breakdown:
- Quality: This dimension consistently ranks the highest for CSCO, with a steady rating of 99 from February to July 2023. This indicates the company’s high-profit margins, strong return on equity, and positive financial health.
- Stability: The Stability rating for Cisco Systems has gradually increased from February (80) to July (85) in 2023. The rising stability rating represents the reliability of Cisco Systems’ share performance compared to other market securities.

How does Cisco Systems Inc. (CSCO) Stack Up Against its Peers?
Other stocks in the Technology - Communication/Networking sector that may be worth considering are PC-Tel Inc. (PCTI), Ceragon Networks Ltd. (CRNT), and Gilat Satellite Networks Ltd. (GILT) -- they have better POWR Ratings.
What To Do Next?
Get your hands on this special report with 3 low priced companies with tremendous upside potential even in today’s volatile markets:
3 Stocks to DOUBLE This Year >
CSCO shares were trading at $52.56 per share on Tuesday afternoon, up $0.52 (+1.00%). Year-to-date, CSCO has gained 12.89%, versus a 20.13% rise in the benchmark S&P 500 index during the same period.
About the Author: Subhasree Kar

Subhasree’s keen interest in financial instruments led her to pursue a career as an investment analyst. After earning a Master’s degree in Economics, she gained knowledge of equity research and portfolio management at Finlatics.
The post Is Cisco Systems (CSCO) a Quality Buy for August? appeared first on StockNews.com