
GameStop Corp. (GME), the signature meme stock, faces frequent executive changes. Recently, the company announced that its finance chief Diana Saadeh-Jajeh would resign this month. This marks the second high-profile exit in two months.
For the fiscal first quarter, the company reported a fall in net sales to $1.24 billion, lower than the $1.36 billion analyst estimate. Following its bleak topline results, the company fired its previous CEO Matthew Furlong and appointed Ryan Cohen as executive chairman, who has an ambitious vision for greater digitization.
GME had placed its hopes on cryptocurrencies to uplift its financial position. However, the company has decided to discontinue its crypto wallet on the backs of regulatory uncertainty, as corporates are still uneasy about digital assets.
Given this backdrop, let’s look at the trends of GME’s key financial metrics to understand why it could be wise to avoid the stock now.
GameStop’s Financial Performance: An Analysis of Fluctuating Trends
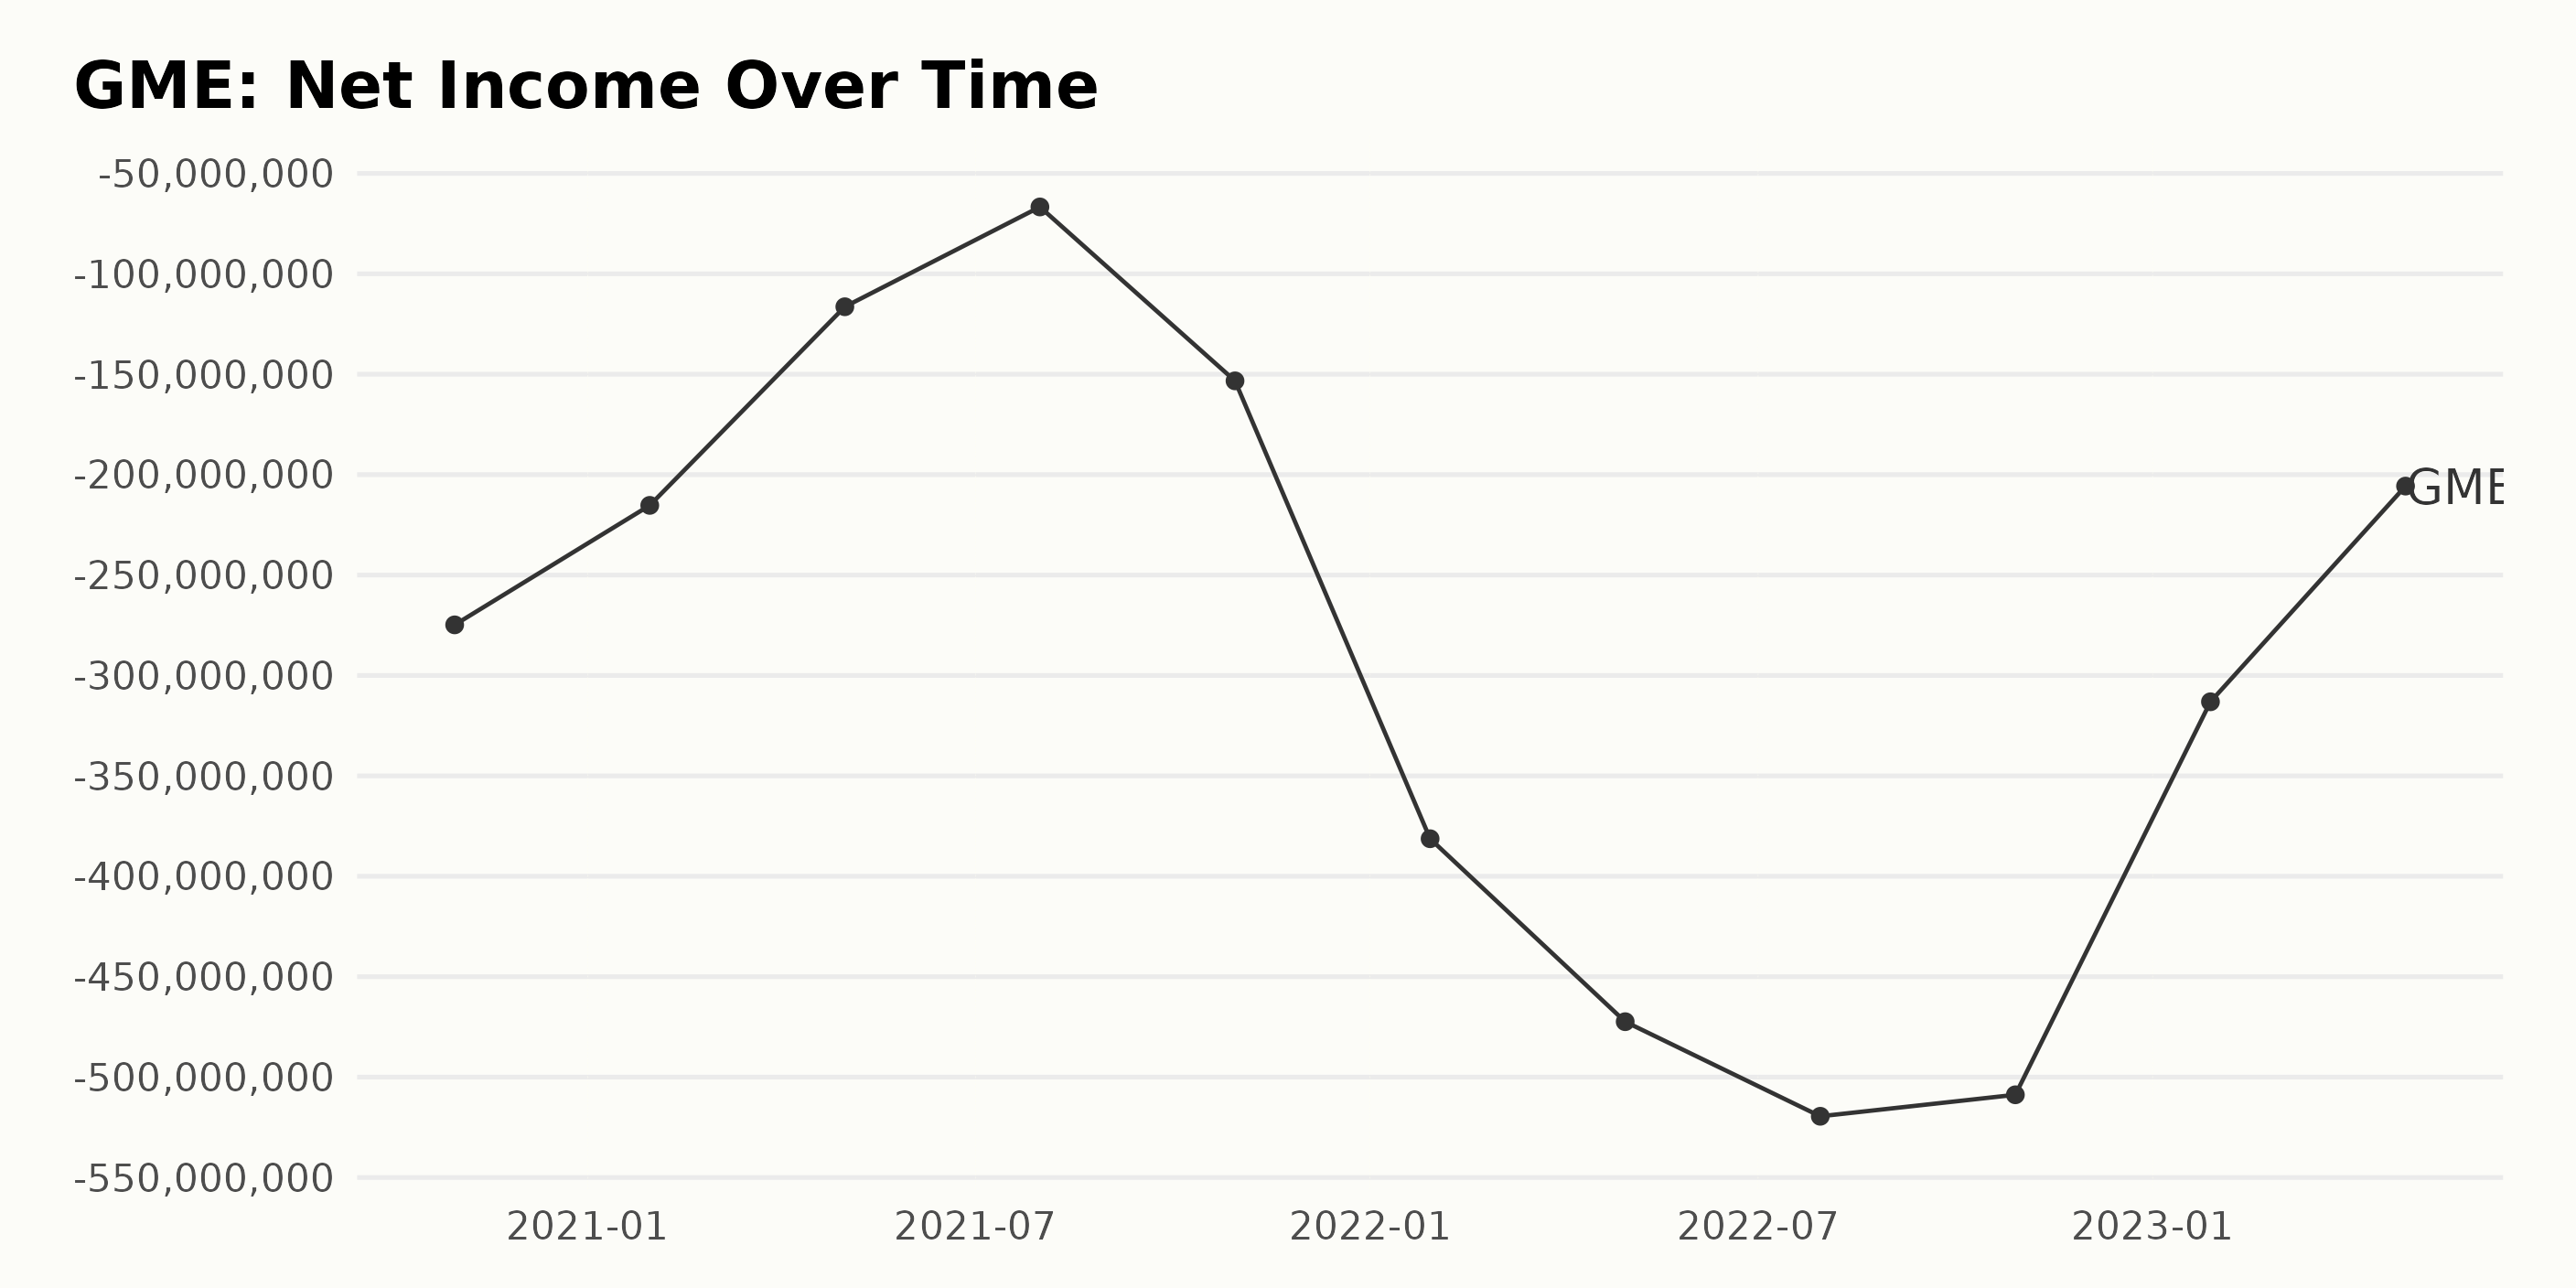
GME has been experiencing a fluctuating trend in its trailing-12-month net income over the series of data presented. Here is a summary analysis:
- October 2020 recorded a net income of -$274.8 million.
- January 2021 showed a marginal improvement with a net income of -$215.3 million.
- By May 2021, there was a significant improvement to -$116.4 million.
- The best showing came in July 2021, when net income was at its lowest deficit -$66.7 million.
- Unfortunately, the following months saw a series of increasing deficits, culminating with a net income detrimental peak of -$519.5 million in July 2022.
- The latter part of 2022 indicates some recovery in this trend, but the situation remains precarious. By October 2022, net income remained negative but slightly lower than the previous at -$508.8 million.
- The beginning of 2023 saw net income increase substantially to -$313.1 million by January and further up by April 2023 to -$205.7 million.
Though the recent quarters indicate some improvements, overall, it reveals a heightened level of uncertainty surrounding GME’s profitability.
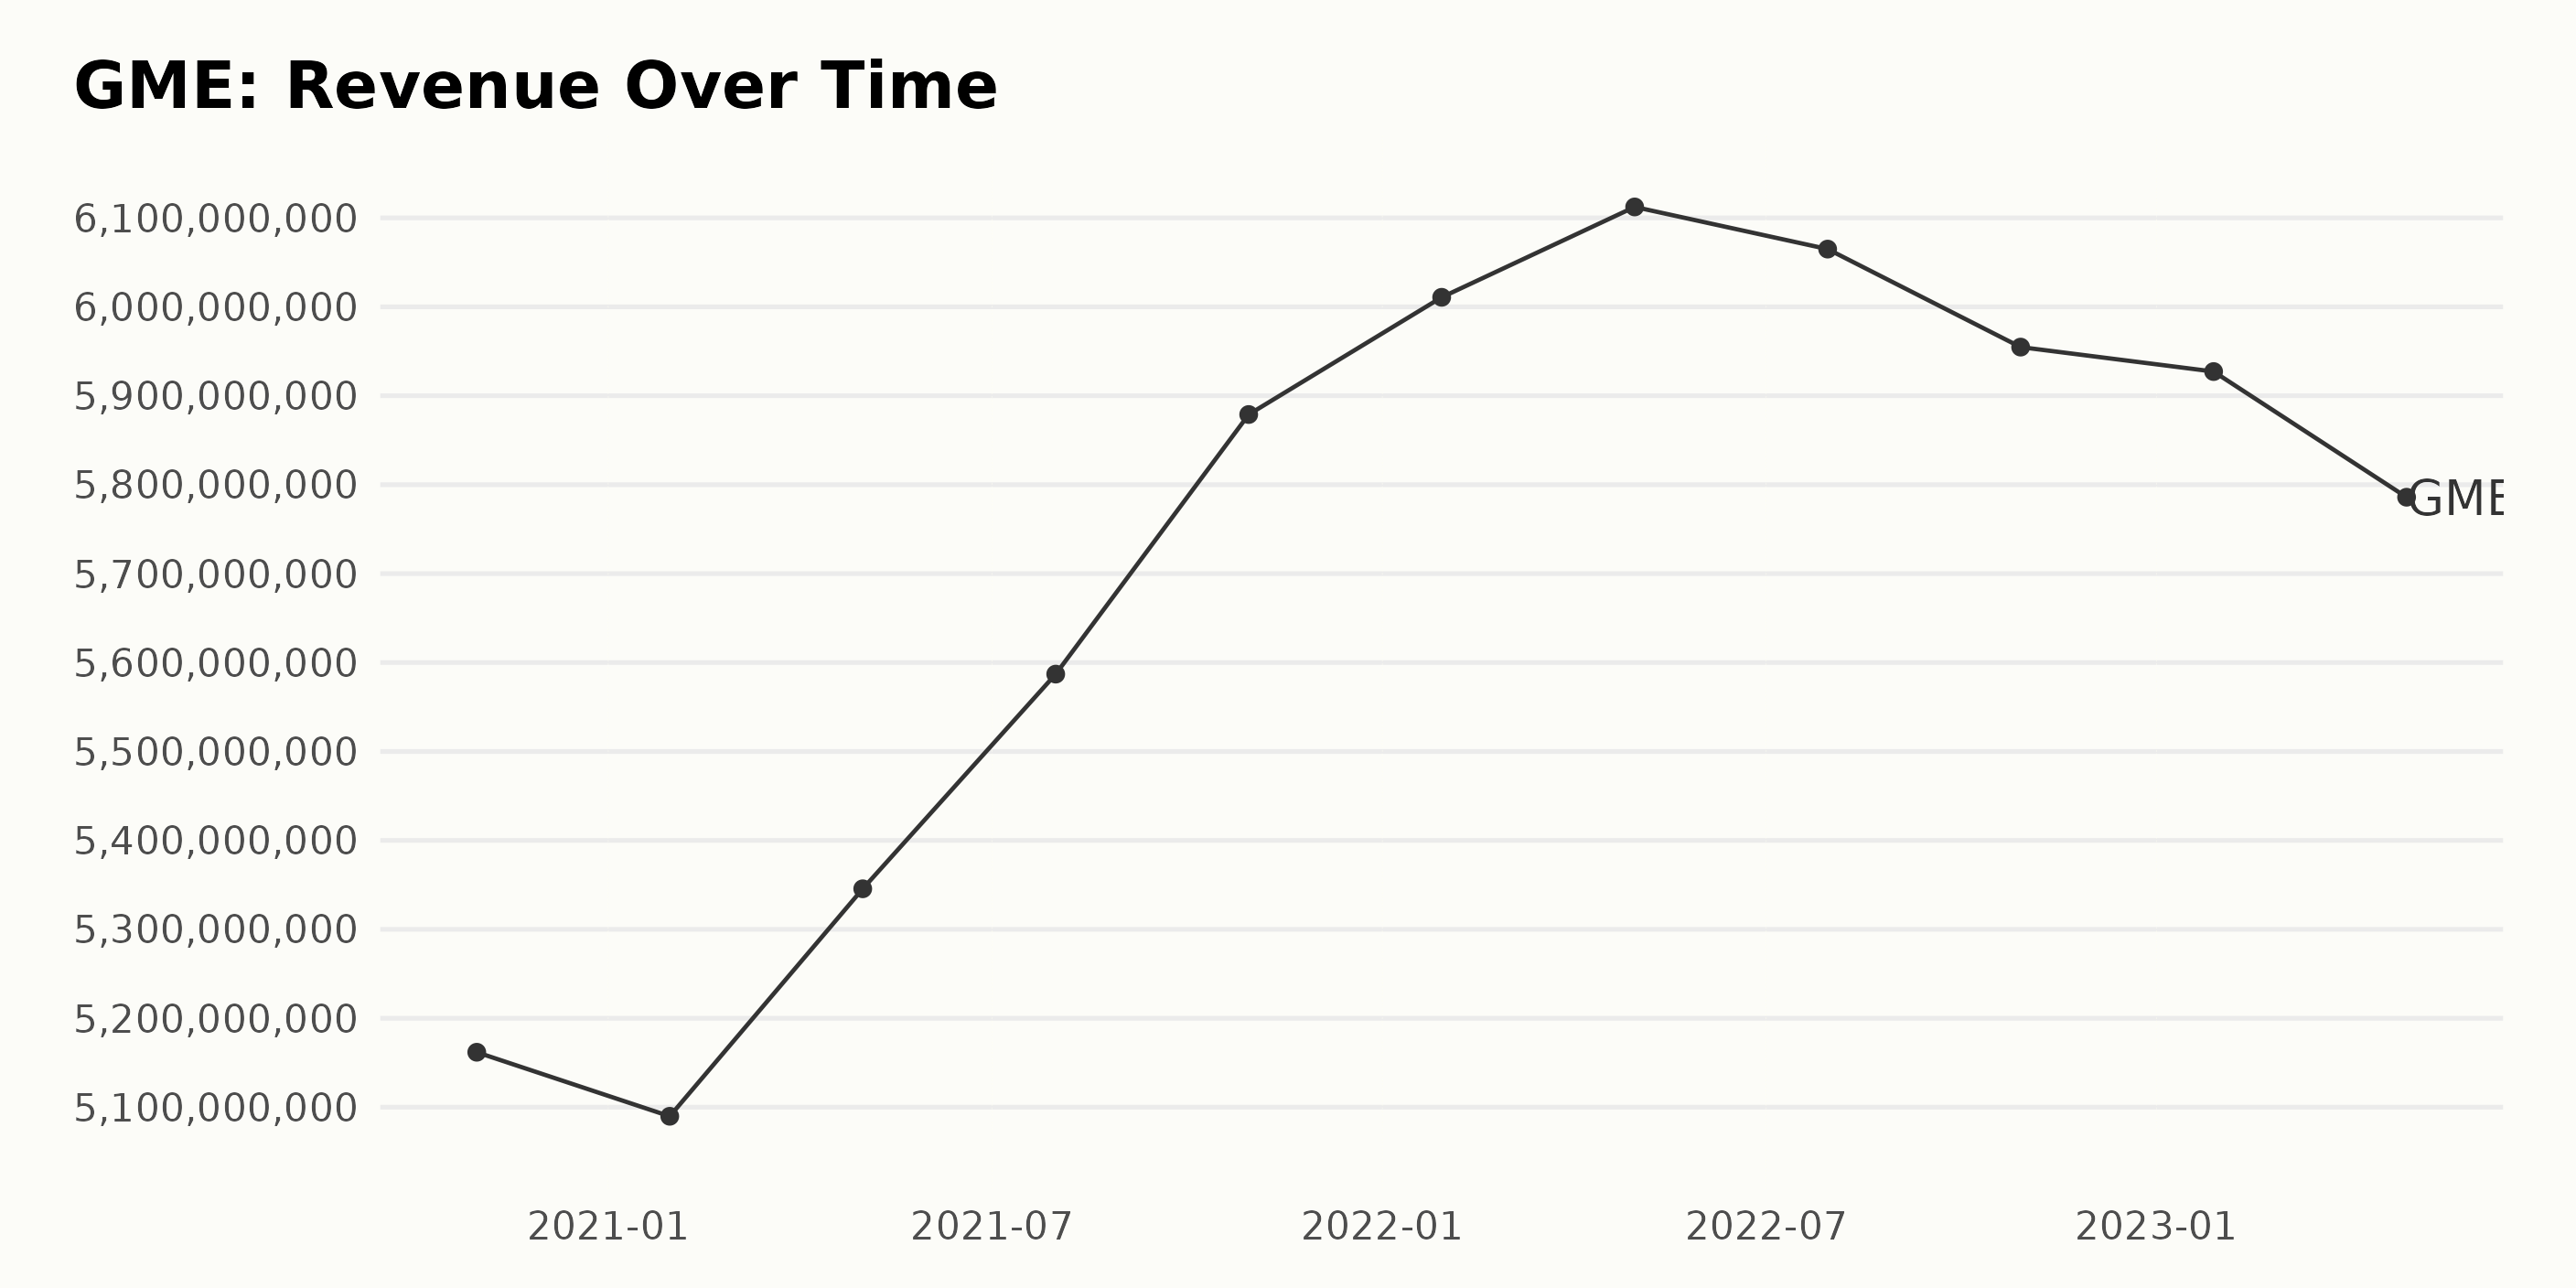
From the provided data, it is clear that GME has experienced both growth and fluctuation in its trailing-12-month revenue over the recent years. Here's a quick summary of the trend:
- In October 2020, GME reported a Revenue of $5.16 billion.
- The revenue then slightly declined to $5.09 billion by January 2021, only to increase again to $5.34 billion in May 2021.
- Encouragingly, the company saw consistent growth in its revenue over the next two quarters, peaking at $6.11 billion in April 2022.
- However, this uptrend couldn't be sustained, as the revenue dipped to $6.06 billion in July 2022 and further decreased to $5.95 billion by October same year.
- The most recent data indicates that this decline persisted, with the revenue decreasing again to $5.79 billion as of April 2023.
In terms of growth rate from the first value in October 2020 ($5.16 billion) to the last value in April 2023 ($5.79 billion), there has been an increase of around 12%. However, the recent trend shows a slight decline.
This suggests that while GME’s revenue demonstrated significant growth within the first few years, it's currently in a period of slight decline. The management would assess their financial strategies to arrest this trend.
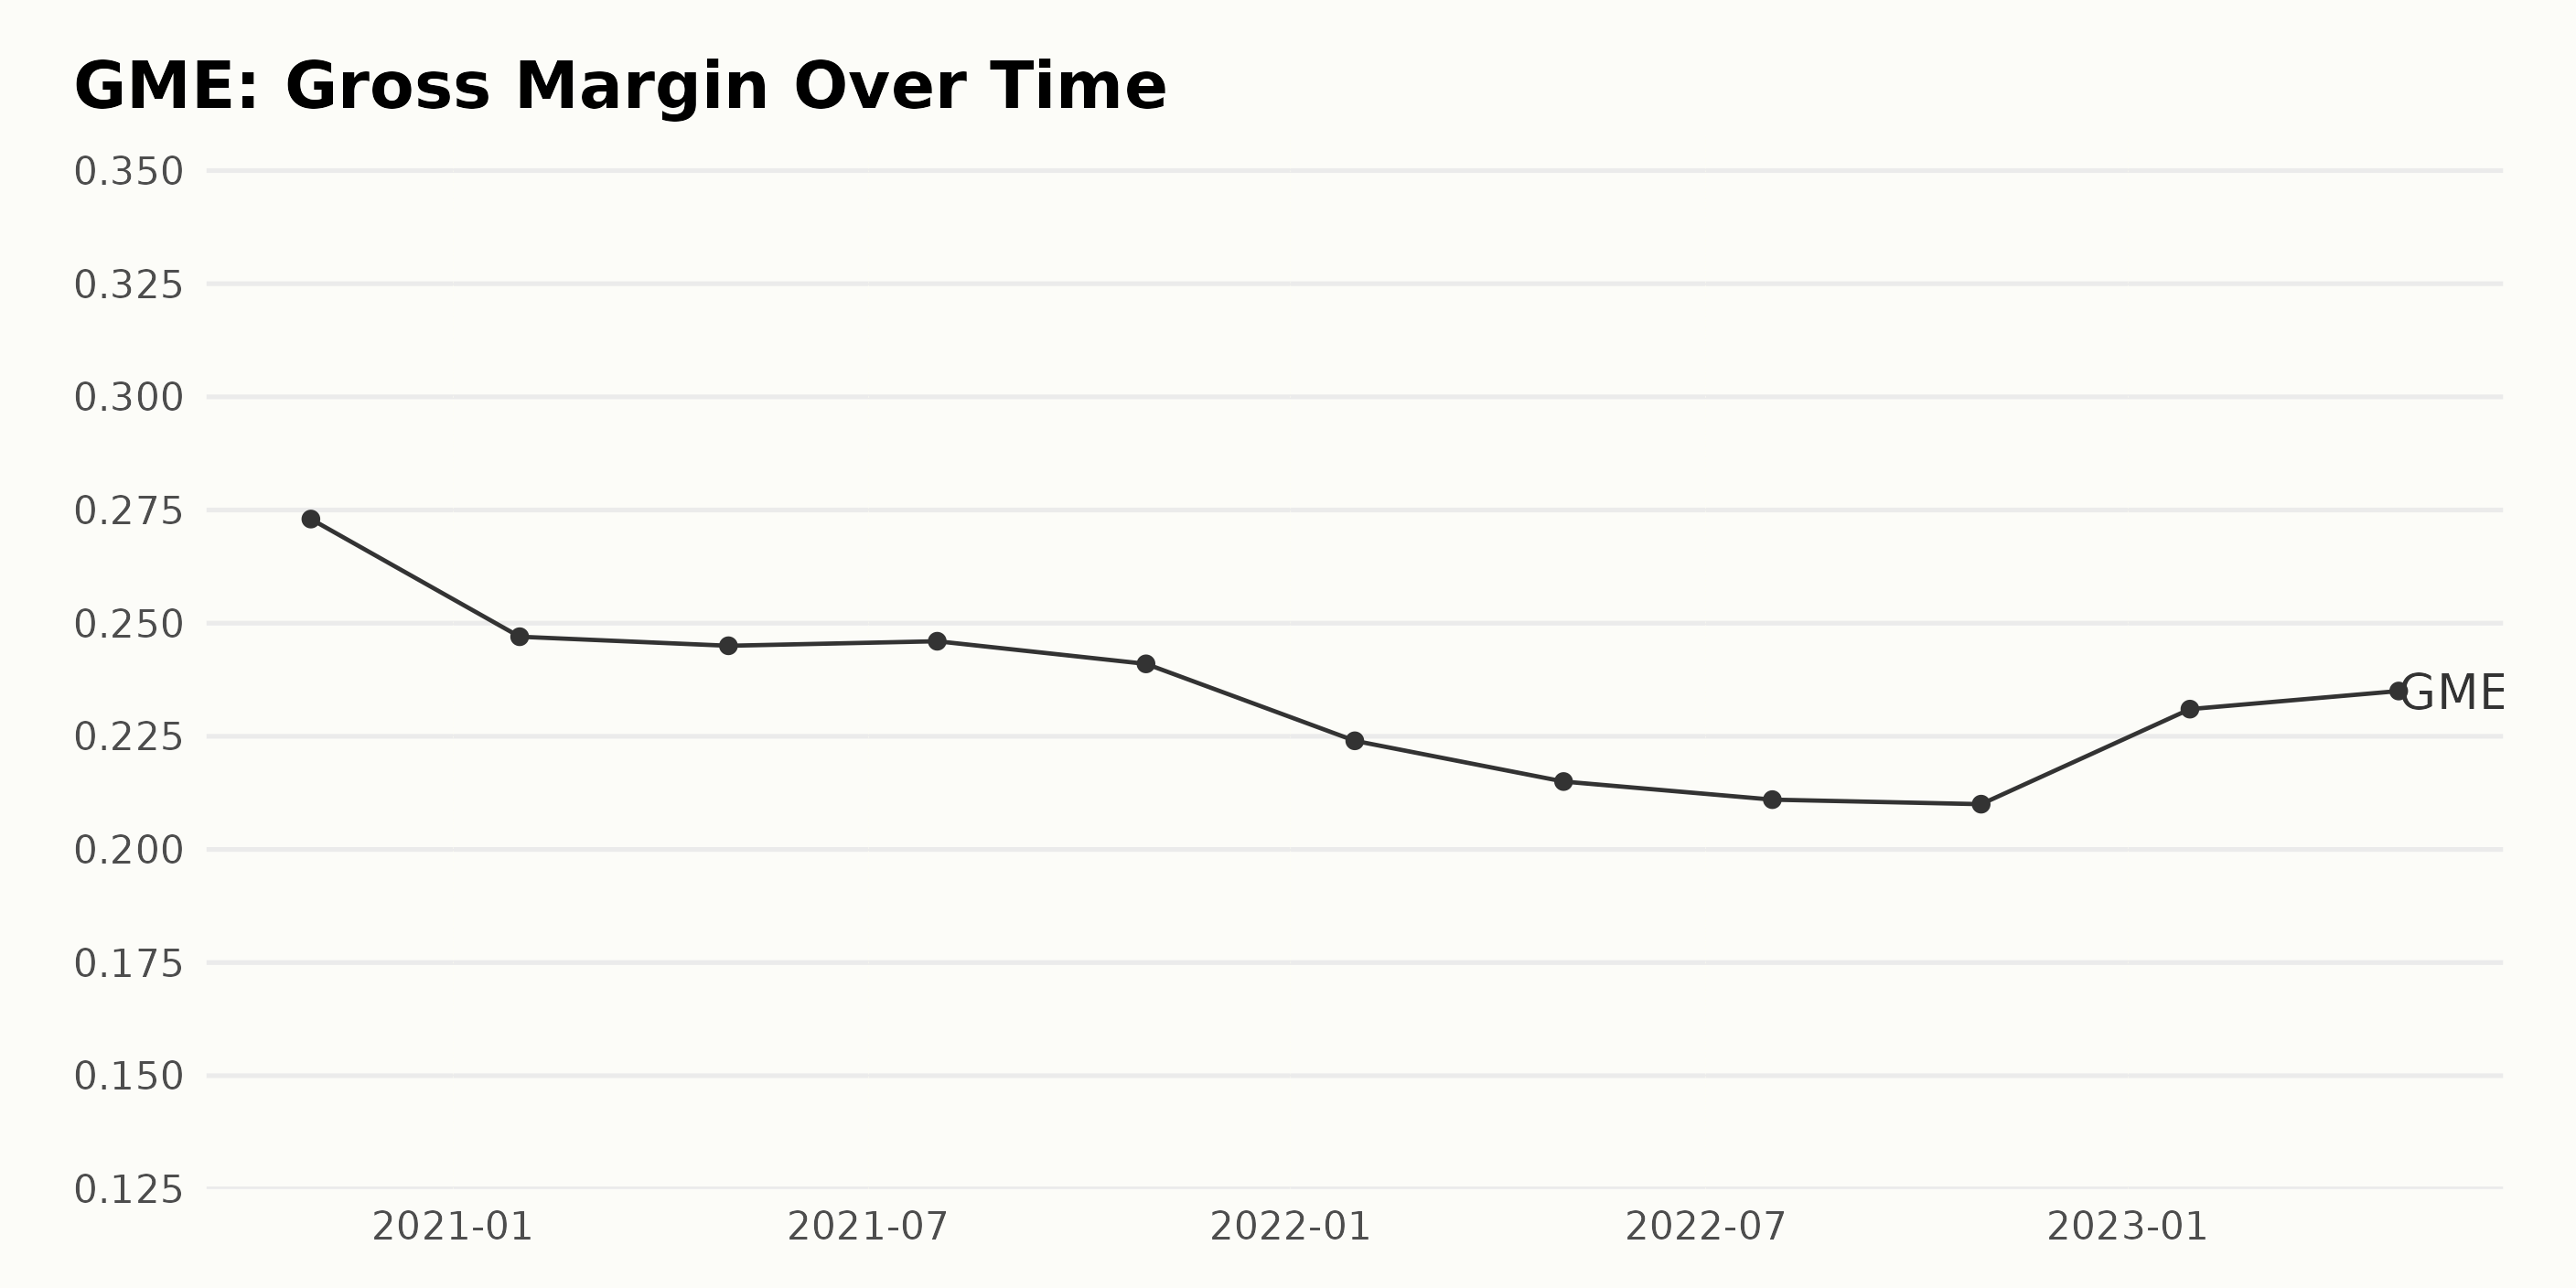
The data series examines the gross margin of GME from October 2020 to April 2023. Here's a summary of the trend and fluctuations observed:
- In October 2020, GME had a gross margin of 27.3%.
- From this point, there was a slight decrease to 24.7% in January 2021, which continued at a similar rate until May 2021, when the rate was 24.5%.
- While there were minor fluctuations over mid-2021, by October 2021, the gross margin declined to 24.1%, hinting at a steadier descending trend.
- This trend carried forward into 2022, reflected in a significant dip to 21.1% by July. The gross margin decreased again and reached its lowest value at 21% in October 2022.
- However, a noticeable change occurred in the first quarter of 2023. The gross margin rose to 23.1% by January 2023 and 23.5% by April 2023, marking a reversal in the declining trend.
From the initial value of 27.3% in October 2020 to the most recent value of 23.5% by April 2023, GME's gross margin has experienced a relative decrease of approximately 13.92%. This pattern highlights the volatile nature of the corporation's gross margin, with an overall decline followed by a promising recovery in early 2023.
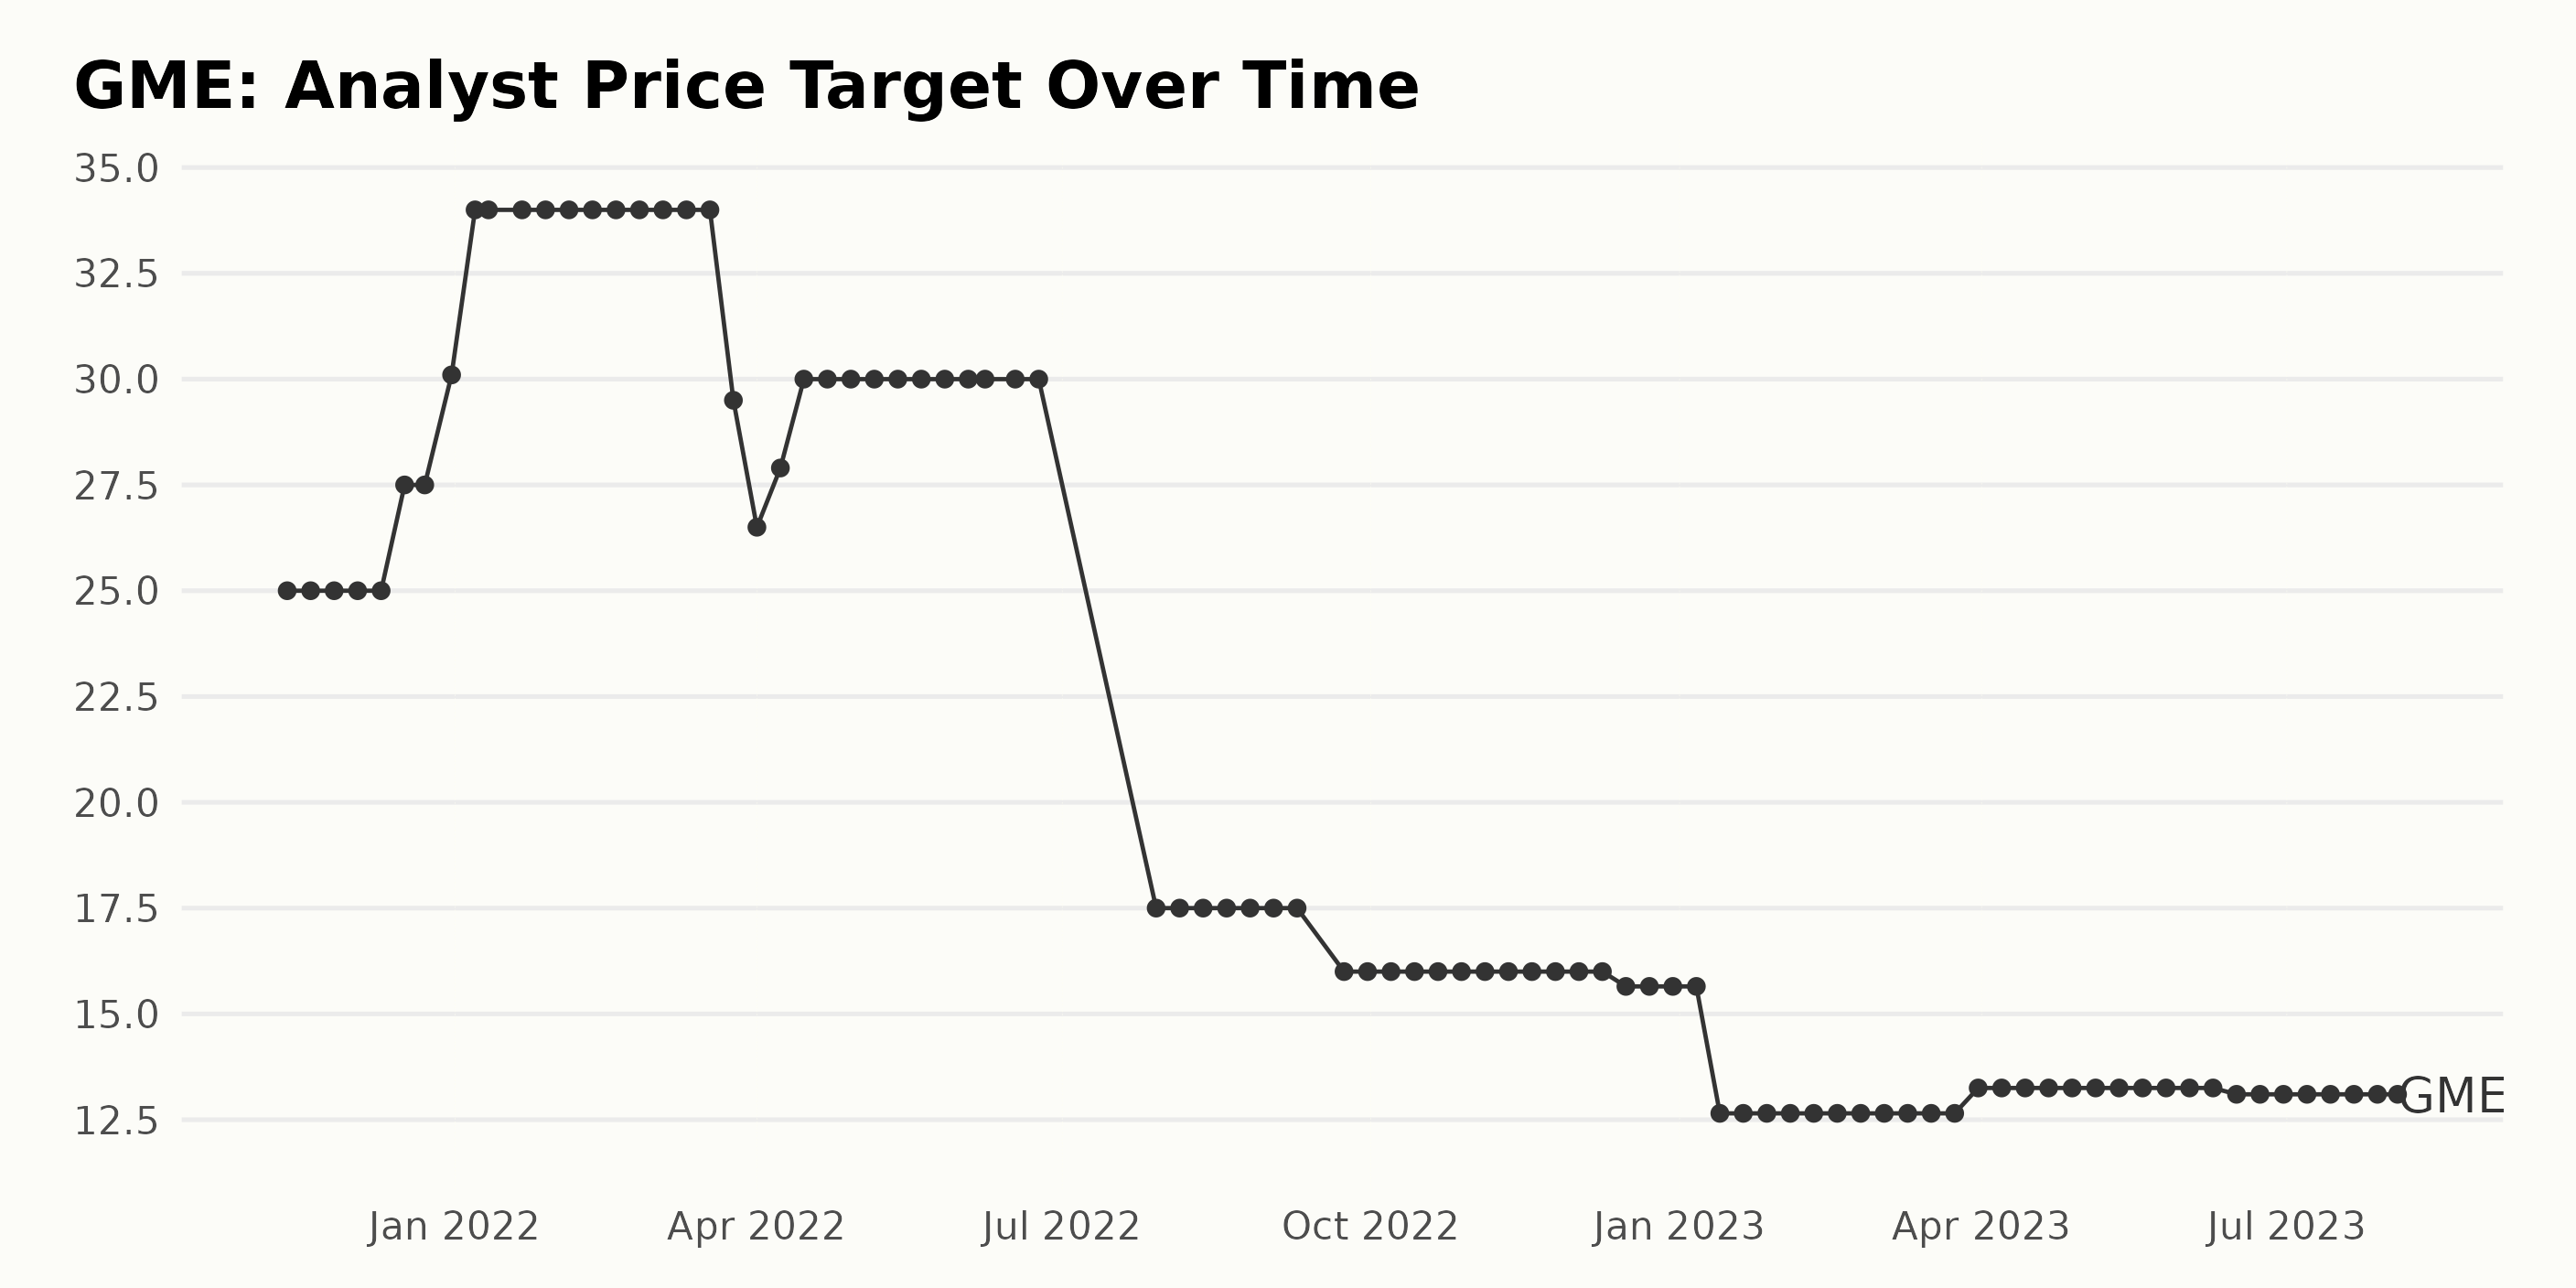
The analyst price target for GME showed notable trends and fluctuations over the observed period. Here's a summarized perspective:
- Starting at $25 on November 12, 2021, the price target remained steady until mid-December 2021.
- It then experienced an upward trend, moving from $25 to $34 by January 7, 2022.
- The price target plateaued at $34 from January 7, 2022, through to March 18, 2022, before dropping to $29.5 by March 25, 2022, and further fell to $26.5 in April.
- However, there was a slight recovery to $30 by mid-April, which held steady until late June but dropped sharply to $17.5 by the end of July.
- The pricing stayed at about $17.5 until September 23, after which it significantly dropped to $16, remaining consistent till December 9, 2022.
- There was a minor decrease to $15.65 by December 16, 2022. This value persisted until mid-January 2023.
- A marked dip occurred in January 2023, when the price target declined to $12.65.
- The price target remained unchanged at $12.65 until March 31, 2023, when it saw a slight increase to $13.25.
- This improved target continued into June, witnessing a minor decline to $13.1 by June 16, 2023, a stable value up to the last data point on August 3, 2023.
In estimating the overall growth rate from the first value to the last, the analyst price target for GME decreased by approximately 47.6%. This suggests a substantial downward trend in the price target with moments of stability scattered throughout. It is important to emphasize recent data indicating a stalled price target increase following a gradual drop.
Examining GameStop's Rollercoaster Share Price Trends from February to August 2023
Based on the provided data, the share price trend and the growth rate for GME are outlined as follows:
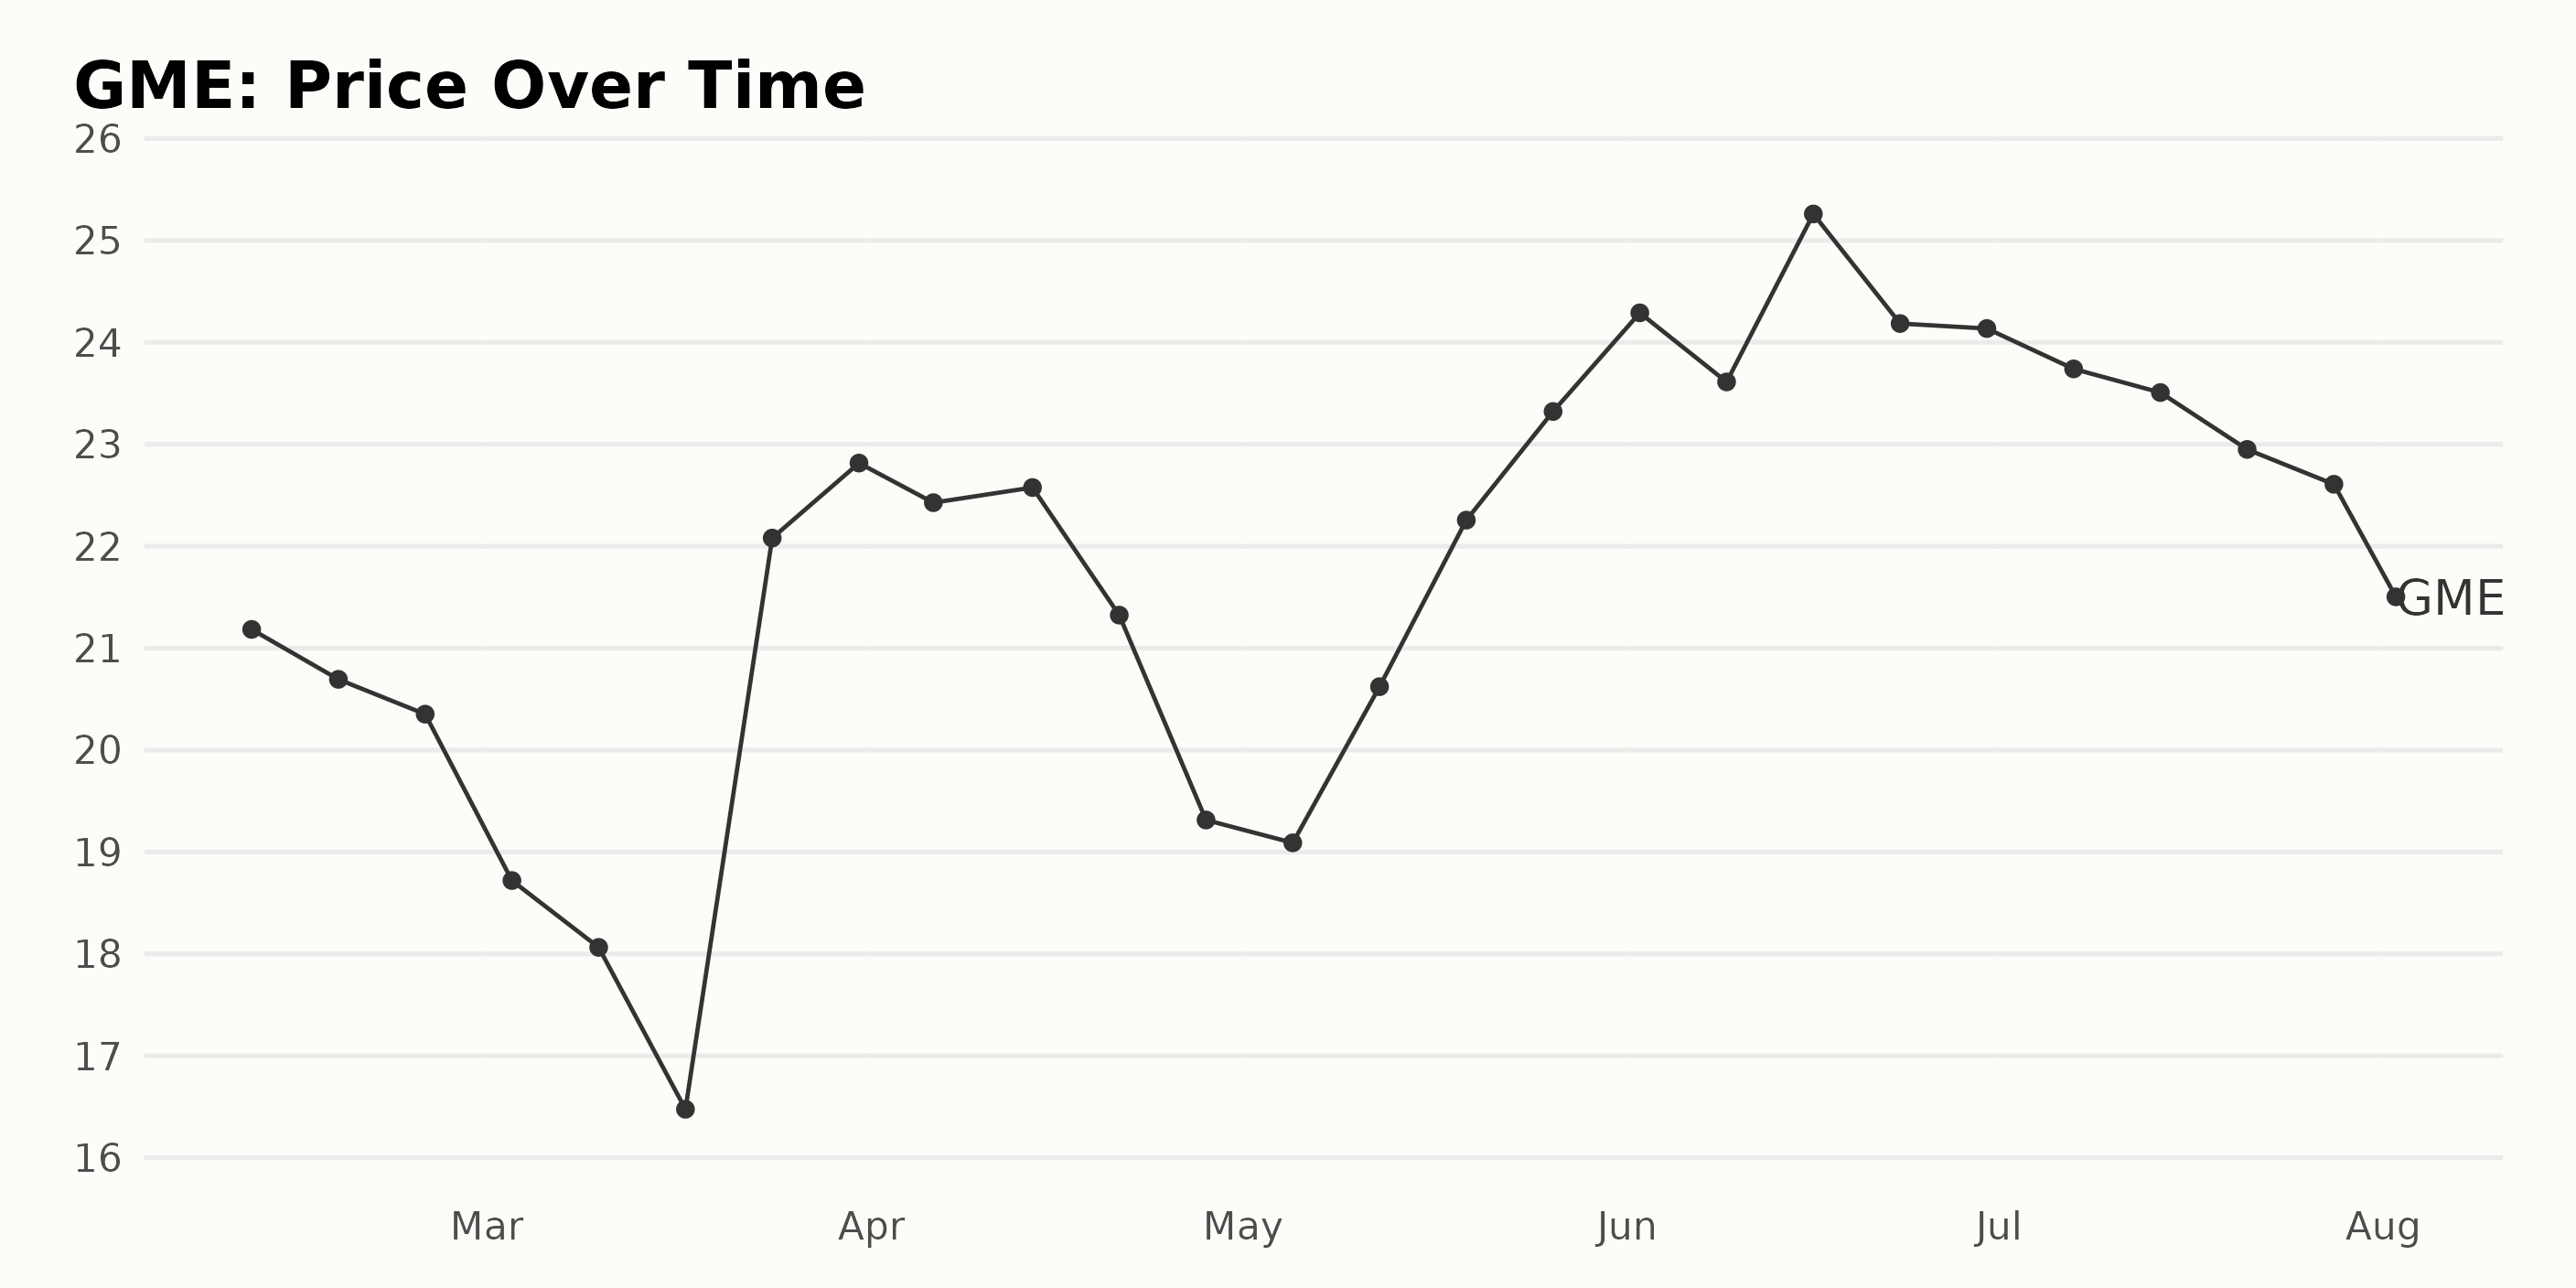
- From February 10, 2023, to March 17, 2023, the share price decreased from $21.18 to $16.48. There existed a consistent downtrend during this timeframe.
- A sharp recovery was seen from March 17, 2023, to March 31, 2023, as the stock price climbed from $16.48 to $22.82. Clearly, a sudden surge was noticed.
- Between March 31, 2023, and April 28, 2023, there was a mild dip, and the price fell to $19.31 at a moderate pace.
- Another price increase started on April 28, 2023, continuing till June 2, 2023, during which the price escalated from $19.31 to $24.29, indicating an upward trend.
- Despite some intermittent decline and increase from June 2, 2023, to July 7, 2023, the overall trend remained largely stable at around $24.
- From July 7, 2023, to August 2, 2023, a slight downward trend is apparent as the price declined from $23.74 to $20.83.
Overall, the share price trend of GME from February to August 2023 portrayed periodic cycles of declines, rises, and plateaus. This reflects volatility in GME’s stock price over the observed period. No clear accelerating or decelerating trends have been identified across this interval. Here is a chart of GME's price over the past 180 days.
Analyzing GameStop’s Performance: A Spotlight on Growth, Quality, and Momentum
The latest POWR Ratings grade of GME as of August 3, 2023, is a D (Sell). GME has a rank of #39 out of 43 stocks in the Specialty Retailers category, meaning it is not performing well compared to other stocks in the same category. Here is a breakdown of how GME's POWR grade and rank-in-category have evolved over the first eight months of 2023:
- From February 4, 2023, to March 18, 2023, GME held a D (Sell) grade and was ranked #44, then improved slightly to #42.
- Starting March 25, 2023, the POWR grade improved to C (Neutral), with a better rank within its category, reaching up to #34 by May 13, 2023, before fluctuating slightly in the weeks that ensued.
- Unfortunately, there was a decline again on June 17, 2023, when the grade fell back to D (Sell) and dropped further in the category, ranking to #40.
- Despite alternating ranks after that point, the overall trend remained negative, with its final recorded grade being a D (Sell) and its rank standing at #39 as of August 3, 2023.
In summary, GME's performance in the period analyzed suggests volatility and a general struggle to maintain a consistent positive rating and a high position in the ranking amongst other Specialty Retailers category stocks.
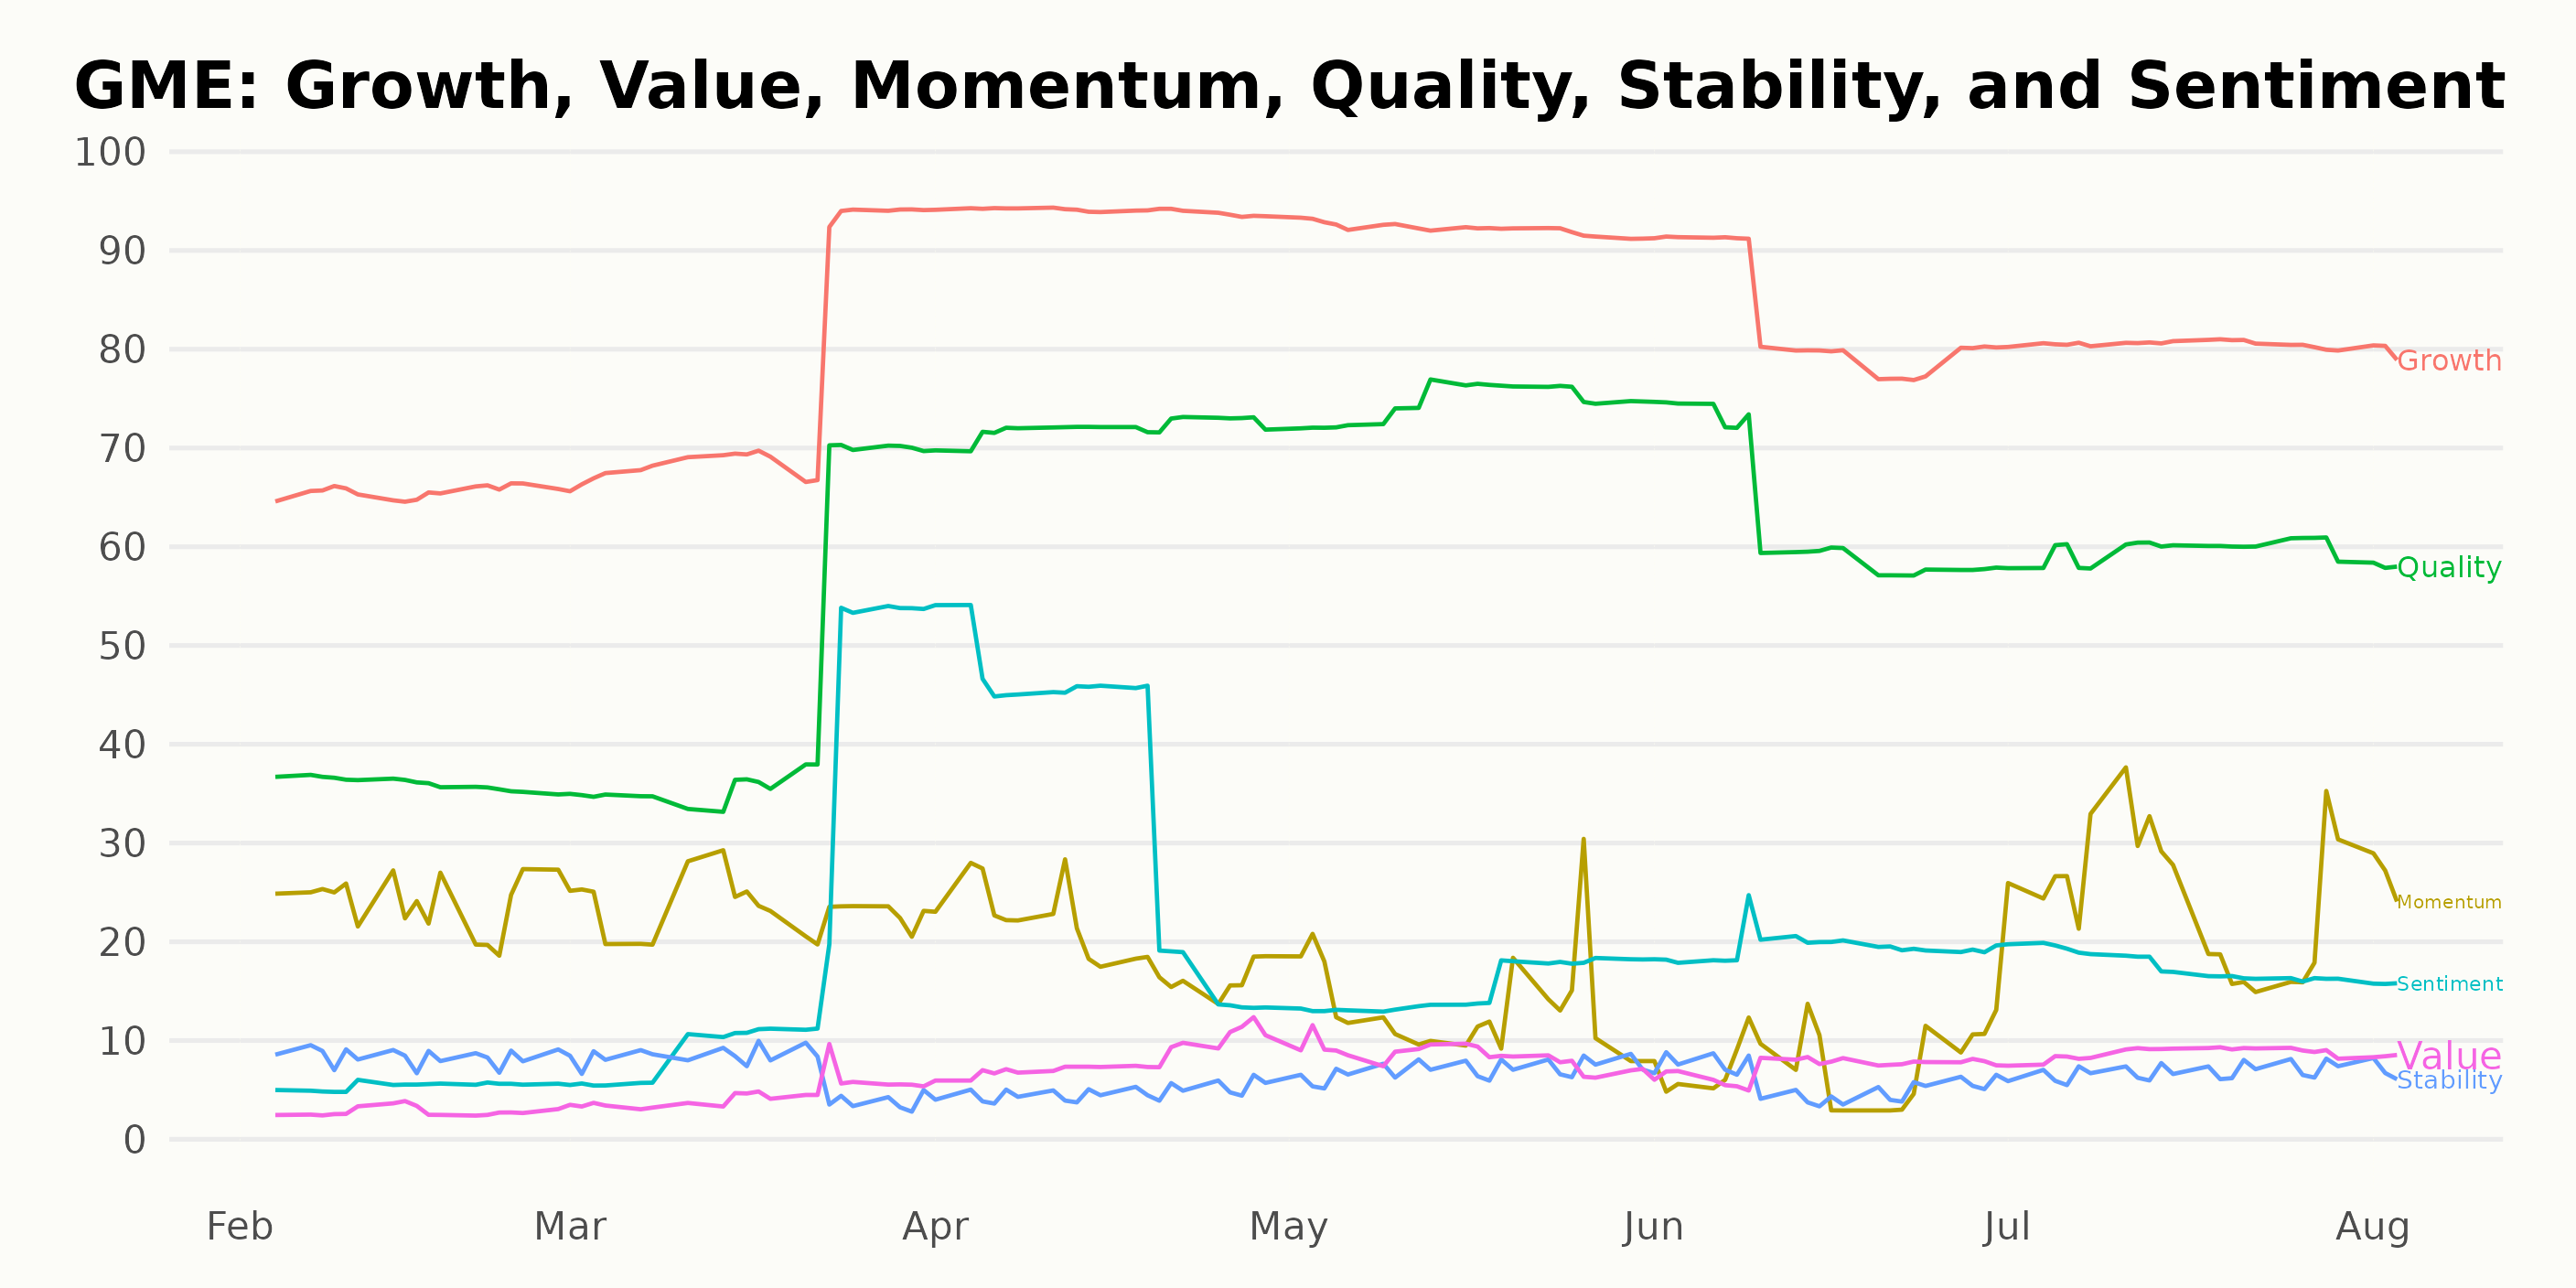
Based on the POWR Ratings data provided for GME, the three most noteworthy dimensions are Growth, Quality, and Momentum. These elements consistently have the highest ratings over time relative to other dimensions. Following is a breakdown of these three dimensions:
Growth: The growth dimension for GME has fairly high ratings throughout the period observed. Starting from February 2023 with a score of 66, this dimension shows a pattern of increase, peaking in April 2023 with a score of 94. Despite some fluctuation, the ratings stay consistently high, rounding off with a score of 80 in August 2023.
Quality: Unlike Growth, the Quality dimension starts with a relatively lower rating of 36 in February 2023 but shows a clear upward trend until May 2023, which peaks at 75. After reaching the peak, it sees a gradual decline ending with a rating of 58 in August 2023.
Momentum: While not peaking as high as Growth or Quality, Momentum is interesting due to its varying trends. From a rating of 24 in February 2023, it shows a general decreasing trend until June 2023, where it stoops down to 8. However, there's a subsequent rebound as the rating increases to finish with a score of 28 in August 2023.
In conclusion, these dimensions provide useful insights into different facets of performance for GME, each showcasing distinct patterns and trends.
How does GameStop Corp. (GME) Stack Up Against its Peers?
Other stocks in the Specialty Retailers sector that may be worth considering are Betterware de México, S.A.P.I. de C.V. (BWMX), The Aaron's Company, Inc. (AAN), and The ODP Corporation (ODP) - they have better POWR Ratings.
What To Do Next?
Discover 10 widely held stocks that our proprietary model shows have tremendous downside potential. Please make sure none of these “death trap” stocks are lurking in your portfolio:
GME shares were trading at $20.97 per share on Thursday afternoon, up $0.14 (+0.67%). Year-to-date, GME has gained 13.60%, versus a 18.46% rise in the benchmark S&P 500 index during the same period.
About the Author: Anushka Dutta

Anushka is an analyst whose interest in understanding the impact of broader economic changes on financial markets motivated her to pursue a career in investment research.
The post What Should Investors’ August Gameplan Be for GameStop (GME)? appeared first on StockNews.com