
Airline company Delta Air Lines, Inc. (DAL) has gained significant momentum prior to the release of its December quarter and full-year 2023 results on January 12. The stock closed its last trading session at $41.63, higher than its 50-day moving average of $37.30 and 200-day moving average of $38.69.
Robust summer travel last year led to an increase in airline profits, with transatlantic travel demand surging. In the third quarter (ended September 30), DAL’s adjusted EPS of $2.03 topped the estimated figure of $1.95.
On the other hand, fuel prices might affect margins this year as the post-pandemic travel surge subsides. Moreover, although company executives expect solid international travel demand going into 2024, softening domestic demand could affect airlines’ pricing power.
Given this backdrop, let’s look at the trends of DAL’s key financial metrics to understand why it could be wise to watch and wait for a more opportune moment to invest in the stock.
Delta Air Lines, Inc.: Fluctuations and Growth in Financial Metrics from March 2021 to September 2023
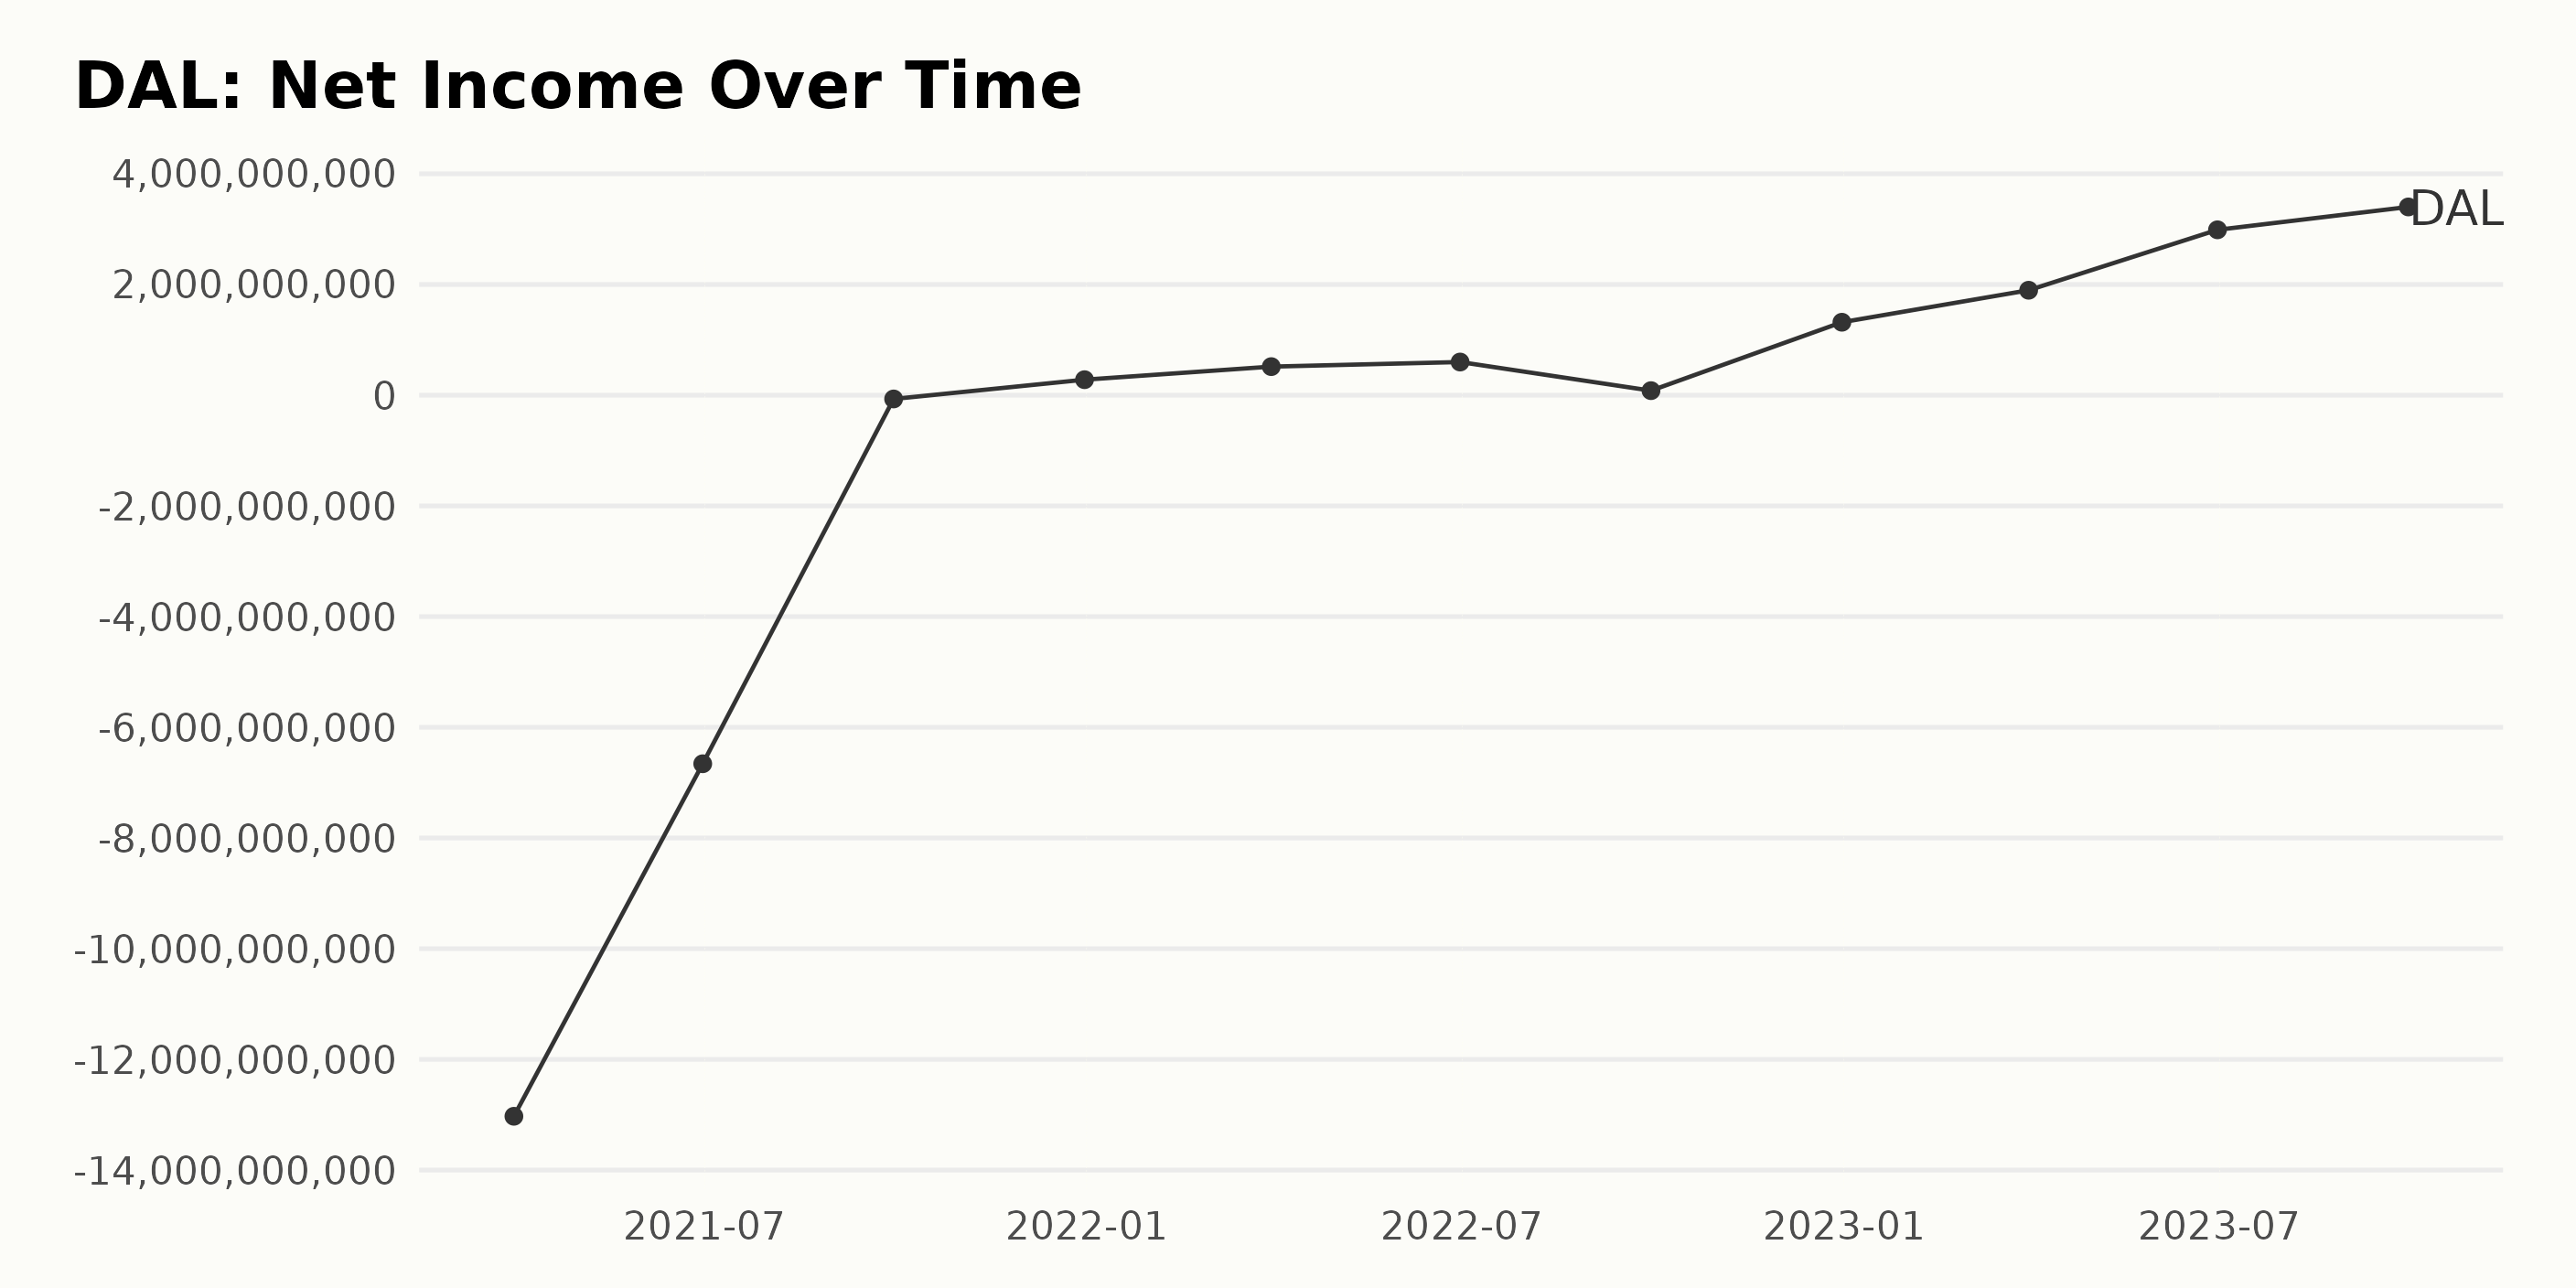
The trailing-12-month net income for DAL has shown a significant improvement from March 2021 to September 2023. Here's a summary of the trend and fluctuations:
- March 31, 2021 - Reported a net loss of -$13.03 billion.
- June 30, 2021 - The net loss was decreased to -$6.66 billion, indicating a financial improvement.
- September 30, 2021 - Continued decrease in net loss to only -$68 million.
- December 31, 2021 – Net income turned into a profit of $280 million, signifying a recovery from previous losses.
- March 31, 2022 - An increase in net profit to $516 million.
- June 30, 2022 - Slight increase in net profit to $599 million.
- September 30, 2022 - Decrease in net profit to $82 million
- December 31, 2022 - Spiked up to $1.32 billion net profit.
- March 31, 2023 - Further increase to $1.9 billion net profit.
- June 30, 2023 - A notable rise in net profit to $2.99 billion.
- September 30, 2023 - Most recent data showing an all-time high net profit of $3.4 billion.
From March 2021 to September 2023, the company transformed a massive deficit of $13.03 billion into a net profit of $3.4 billion, demonstrating impressive financial resilience and growth. Therefore, the overall growth rate for the period is staggering, as they turned a deep negative into a substantial positive.
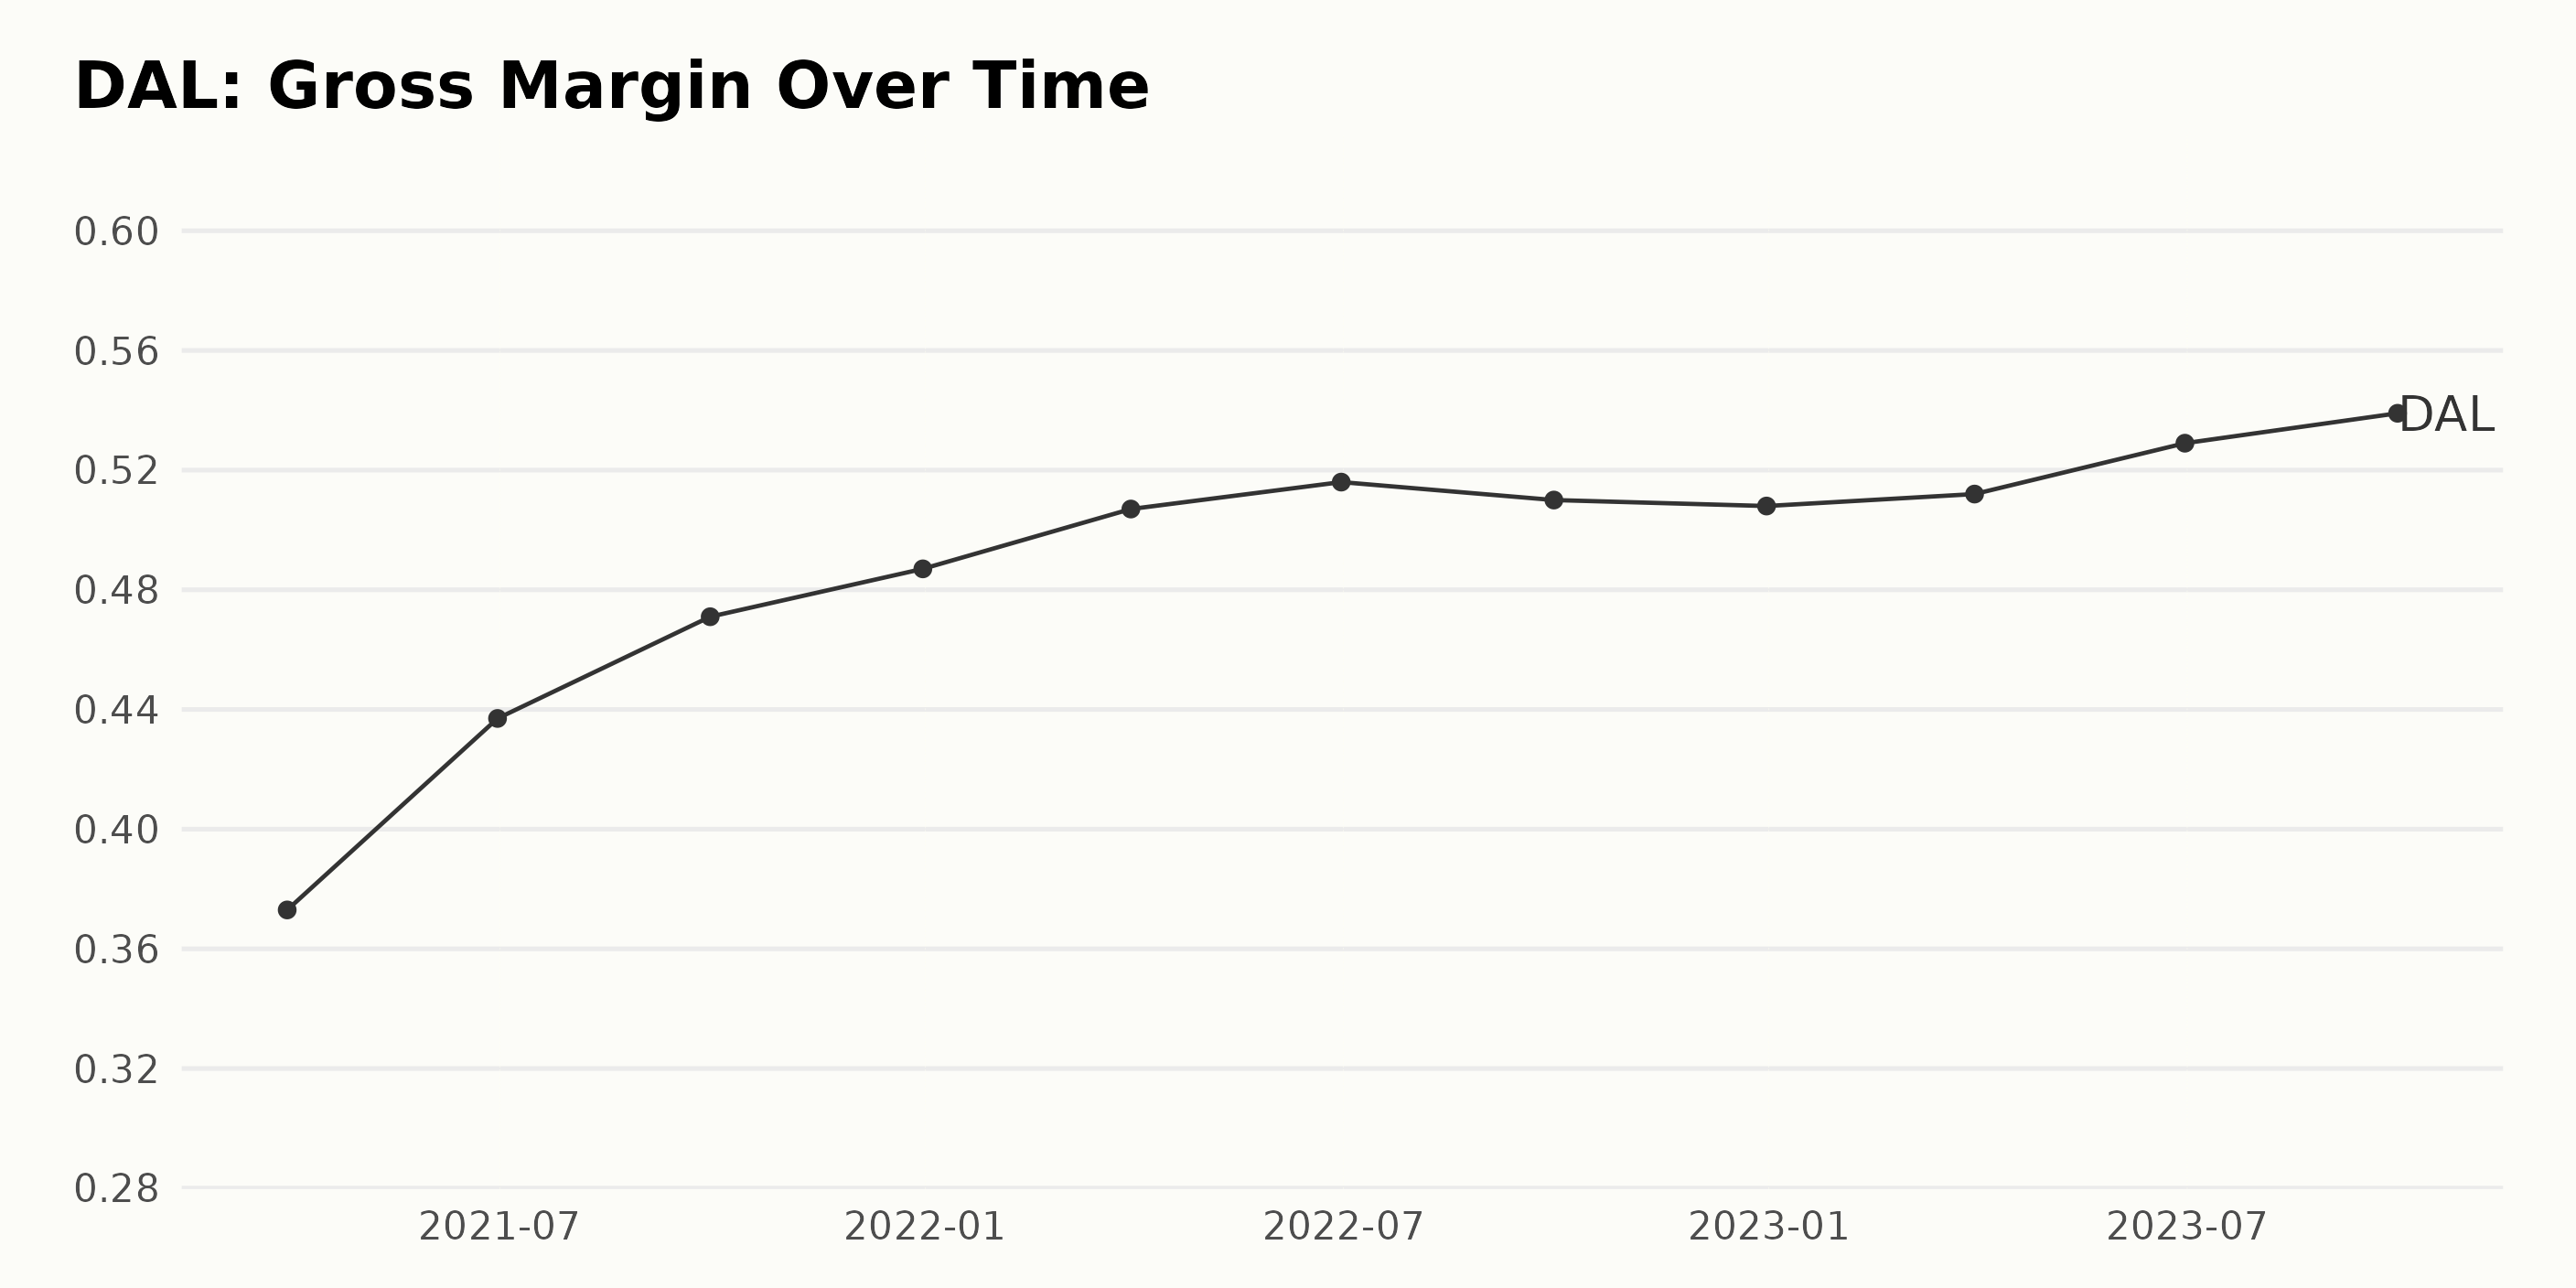
The gross margin for DAL was reported in a series of percentages over the period from March 31, 2021, to September 30, 2023. To summarize:
- March 31, 2021: The gross margin stood at 37.3%.
- The gross margin exhibited an upward trend over the period, with a few slight variations. By June 30, 2021, it had risen to 43.7%, and it continued its rise to reach 47.1% by September 30, 2021.
- There were small increments until it reached 51.6% by June 30, 2022. It slightly dropped to 51% by September 30, 2022, and then further reduced to 50.8% by the end of 2022.
- Nonetheless, in the next year, the gross margin bounced back, achieving its peak value of 53.9% by September 30, 2023.
Taking into account the entire period from March 2021 to September 2023, the gross margin showcased a significant growth rate, ascending from 37.3% to 53.9%. This indicates a positive expansion of approximately 16.6 percentage points during the span of two-and-a-half years.
Greater emphasis on the recent data suggests that despite minor fluctuations, the gross margin of DAL maintains a general advancement in efficiency and profitability.
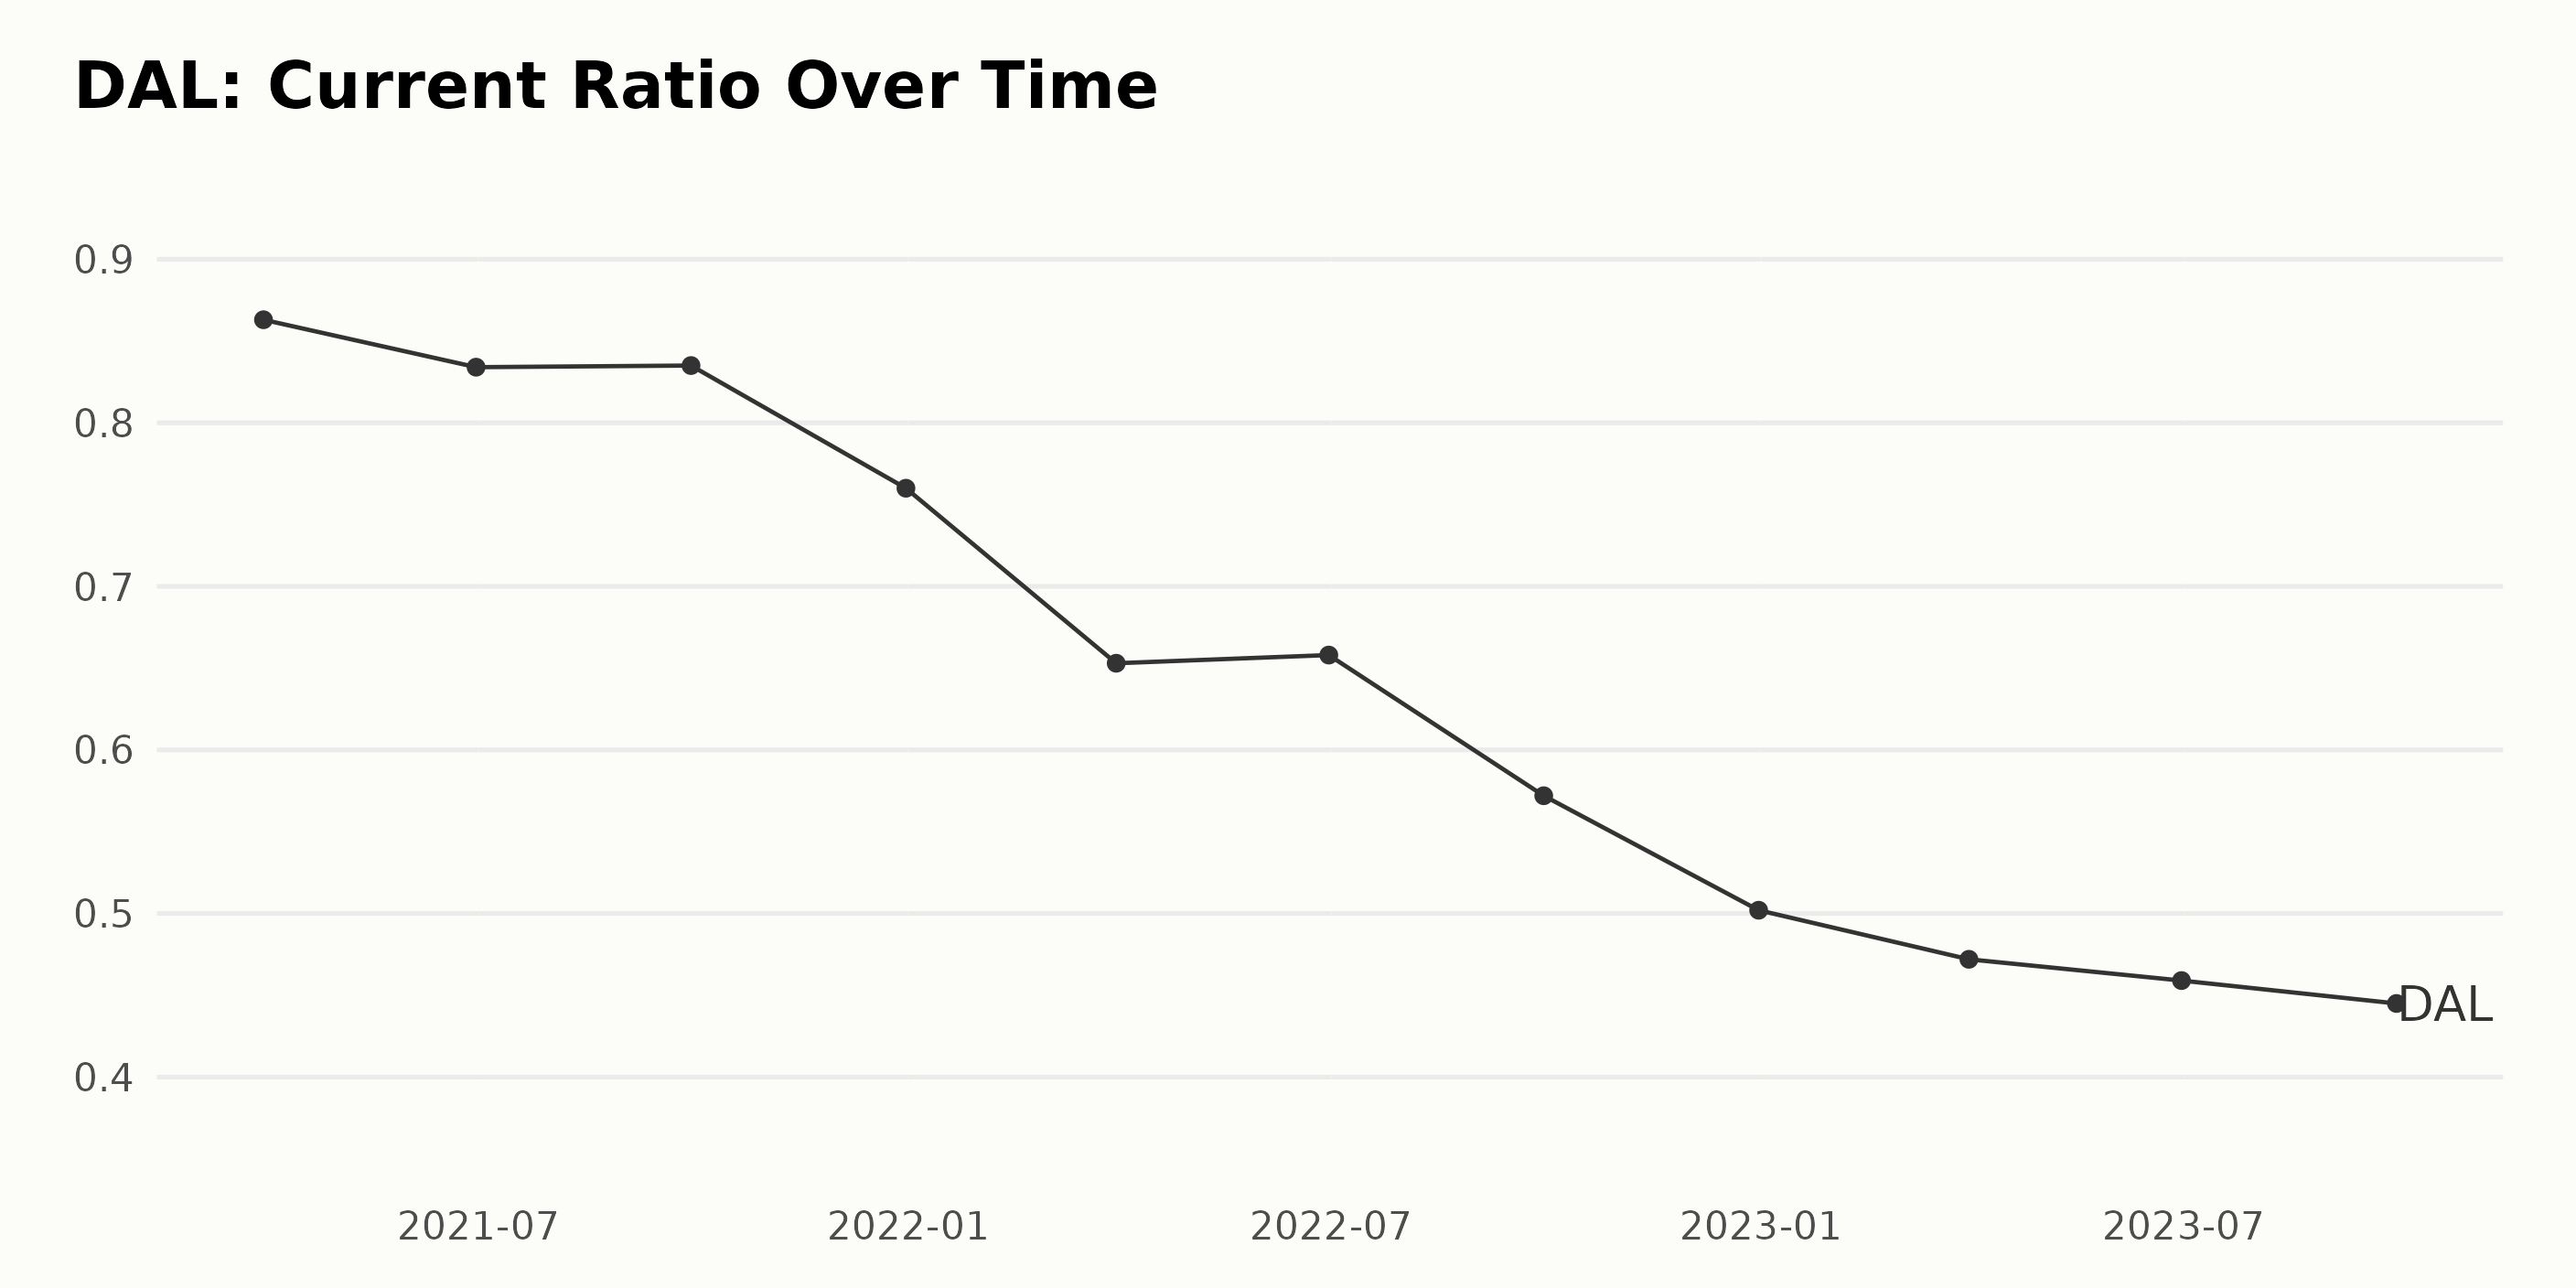
Here is a summary of the fluctuations and trends in the current ratio of DAL from March 2021 to September 2023:
- The current ratio presented a decreasing trend over this period of time.
- On March 31, 2021, the current ratio was 0.863. Over the next two quarters, there were slight decreases, with the ratio falling to 0.834 in June 2021 and 0.835 at the end of September 2021.
- A more significant drop occurred from September 2021 to December 2021, with the current ratio falling to 0.76.
- Thereafter, the downward trend continued into 2022 and 2023. By the end of March 2022, the current ratio had dropped further to 0.653, and it continued to fall consistently over the following quarters, reaching 0.445 by September 30, 2023.
- From the start of the series in March 2021 to the last recorded data in September 2023, the current ratio fell by approximately 48.4%. Therefore, the negative growth rate for this period is about 48.4%.
In conclusion, the declining trend in the current ratio indicates that DAL's ability to cover current liabilities with its current assets has been decreasing steadily in the examined period. This could potentially reflect challenges in liquidity or operational efficiency.
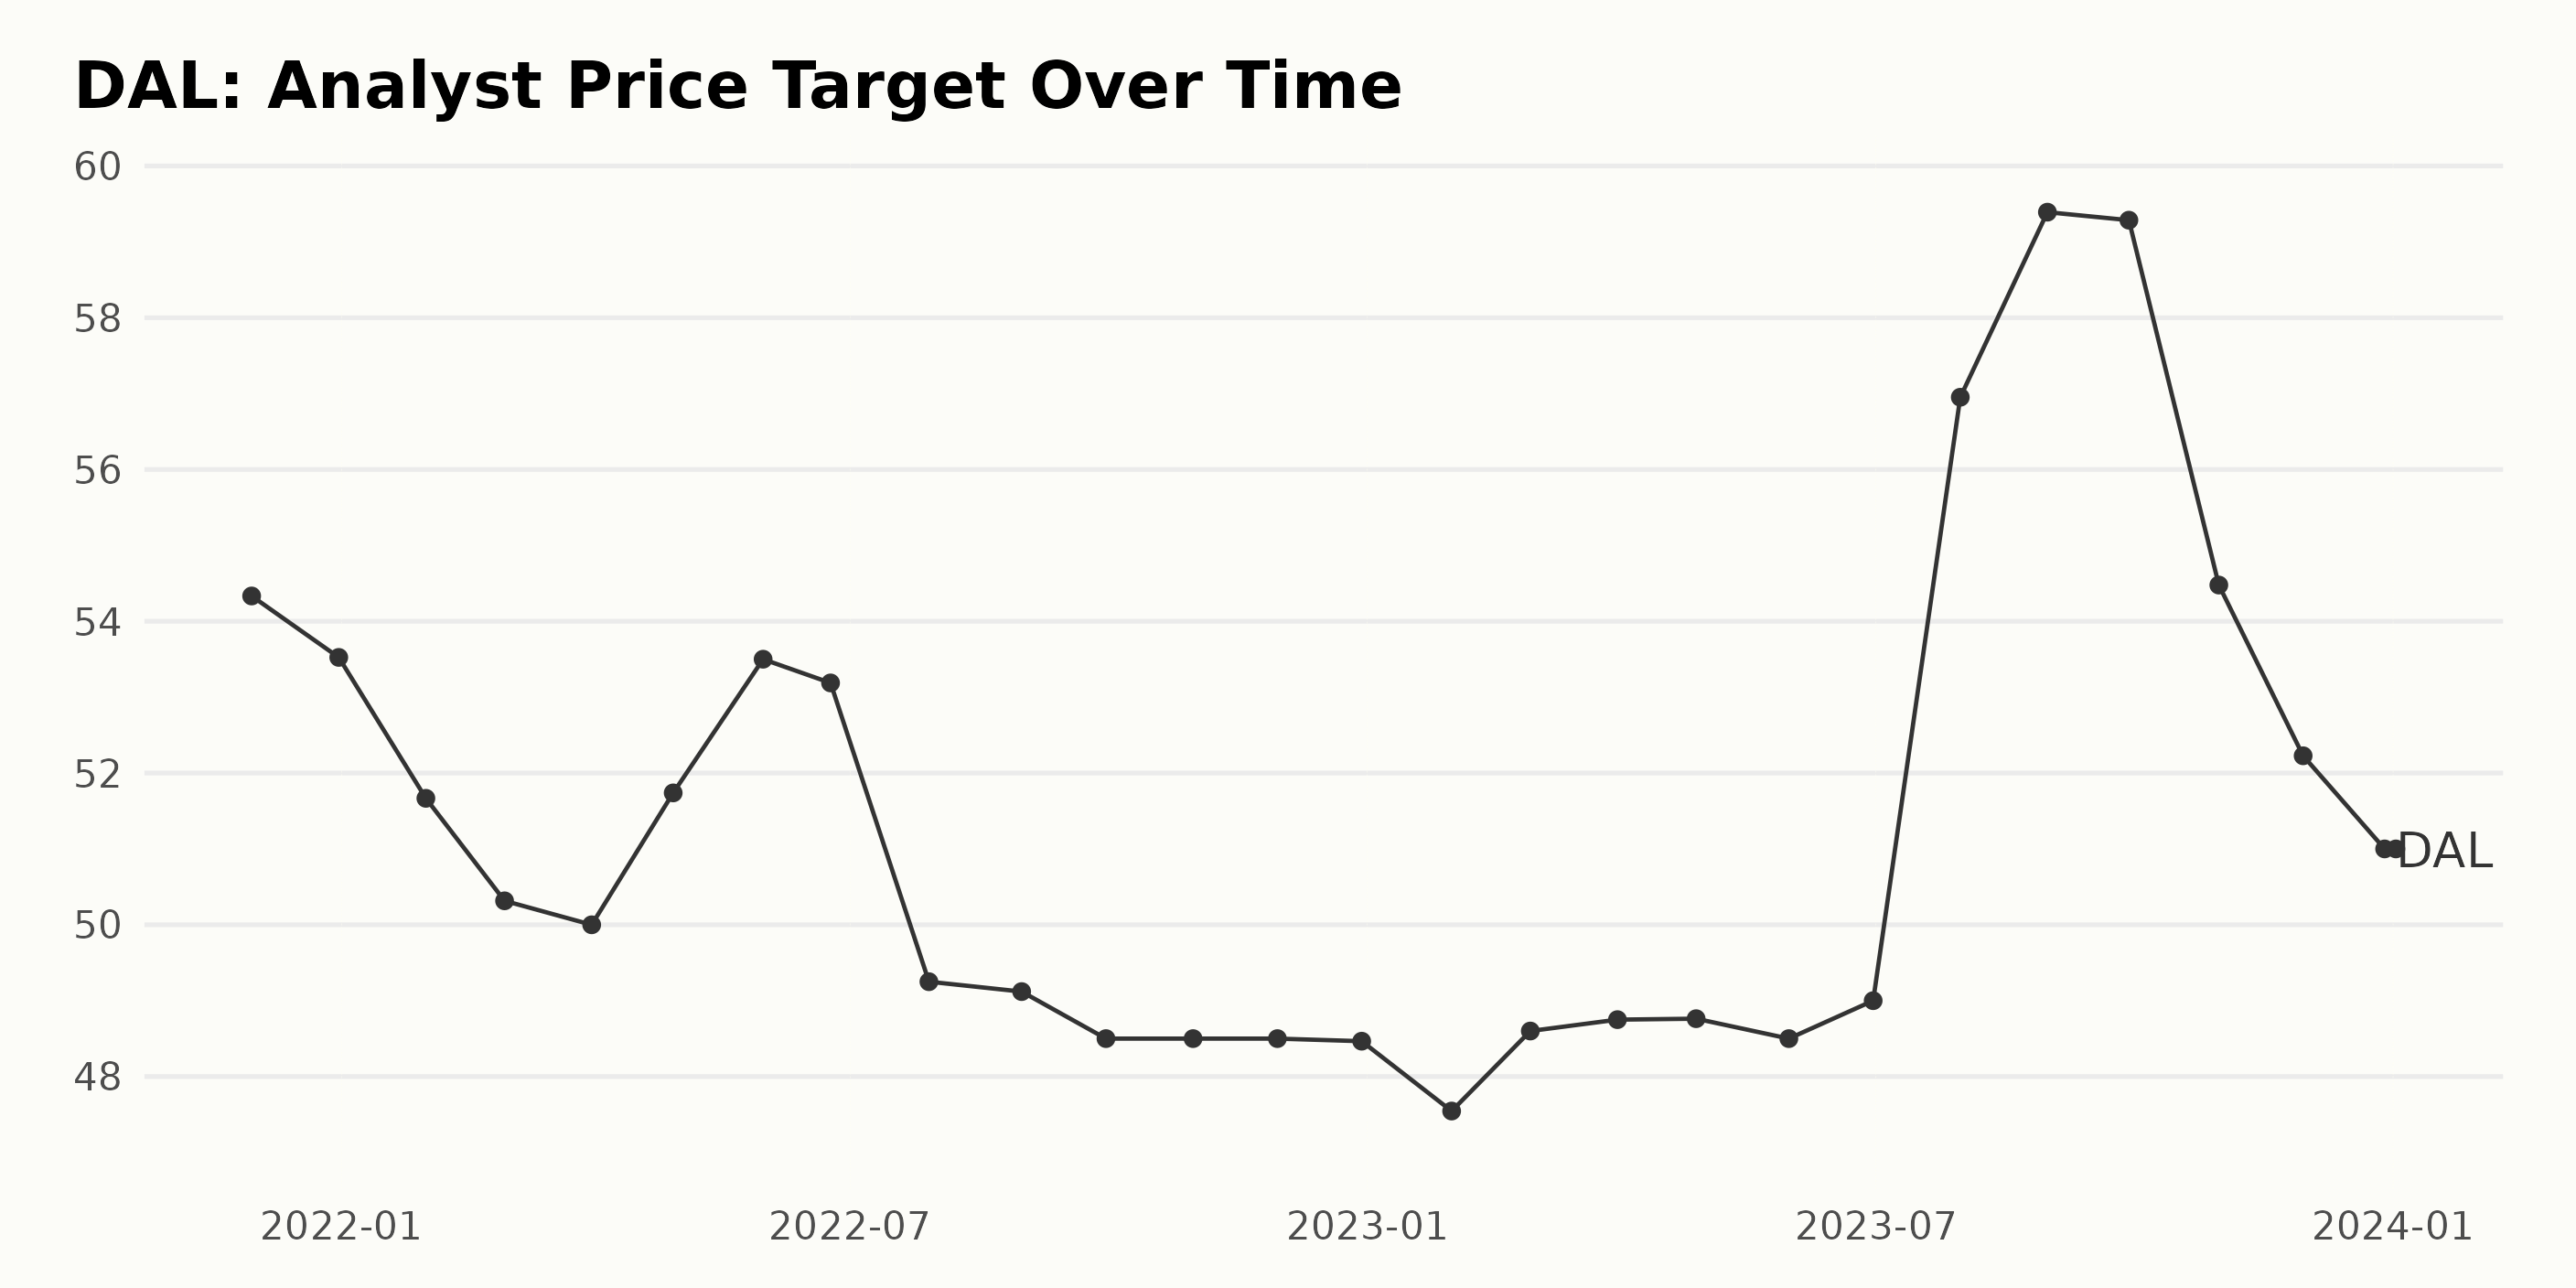
Summary of DAL's analyst price target:
- In November 2021, the analyst price target was at $54.33.
- The data shows a gradual decline in the analyst price target starting from December 2021, when it reached $53.52, and it continued to drop to $50 by March 2022.
- The target price then witnessed a slight uptick to $53.5 by May 2022, which followed a short downfall until September 2022, when it dropped to $48.5 and remained consistently around that figure until early 2023.
- A remarkable increase appeared in July 2023 when the price surged to reach $56.95 and followed an impressive upward trend to peak at $59.39 by August 2023.
- Yet this ascent didn't last much longer, as it started declining again in October 2023 to hit $54.48, and it kept on this downward path until it reached $51 by the end of December 2023.
- The first value from January 2024 indicates that there’s a stabilization, with the analyst price target maintained at $51.
Calculating the growth rate from the first to the last value indicates an overall decrease of about 6.11%. These fluctuations may come as a reflection of changing perceptions and reactions related to external factors related to both the airline industry and the broader economic context.
Delta Air Lines' Fluctuating Share Prices: A Six-Month Analysis from July 2023 to January 2024
The share price of DAL indicates a fluctuating trend during the period from July 2023 to January 2024, as provided in the data. Here is a detailed description:
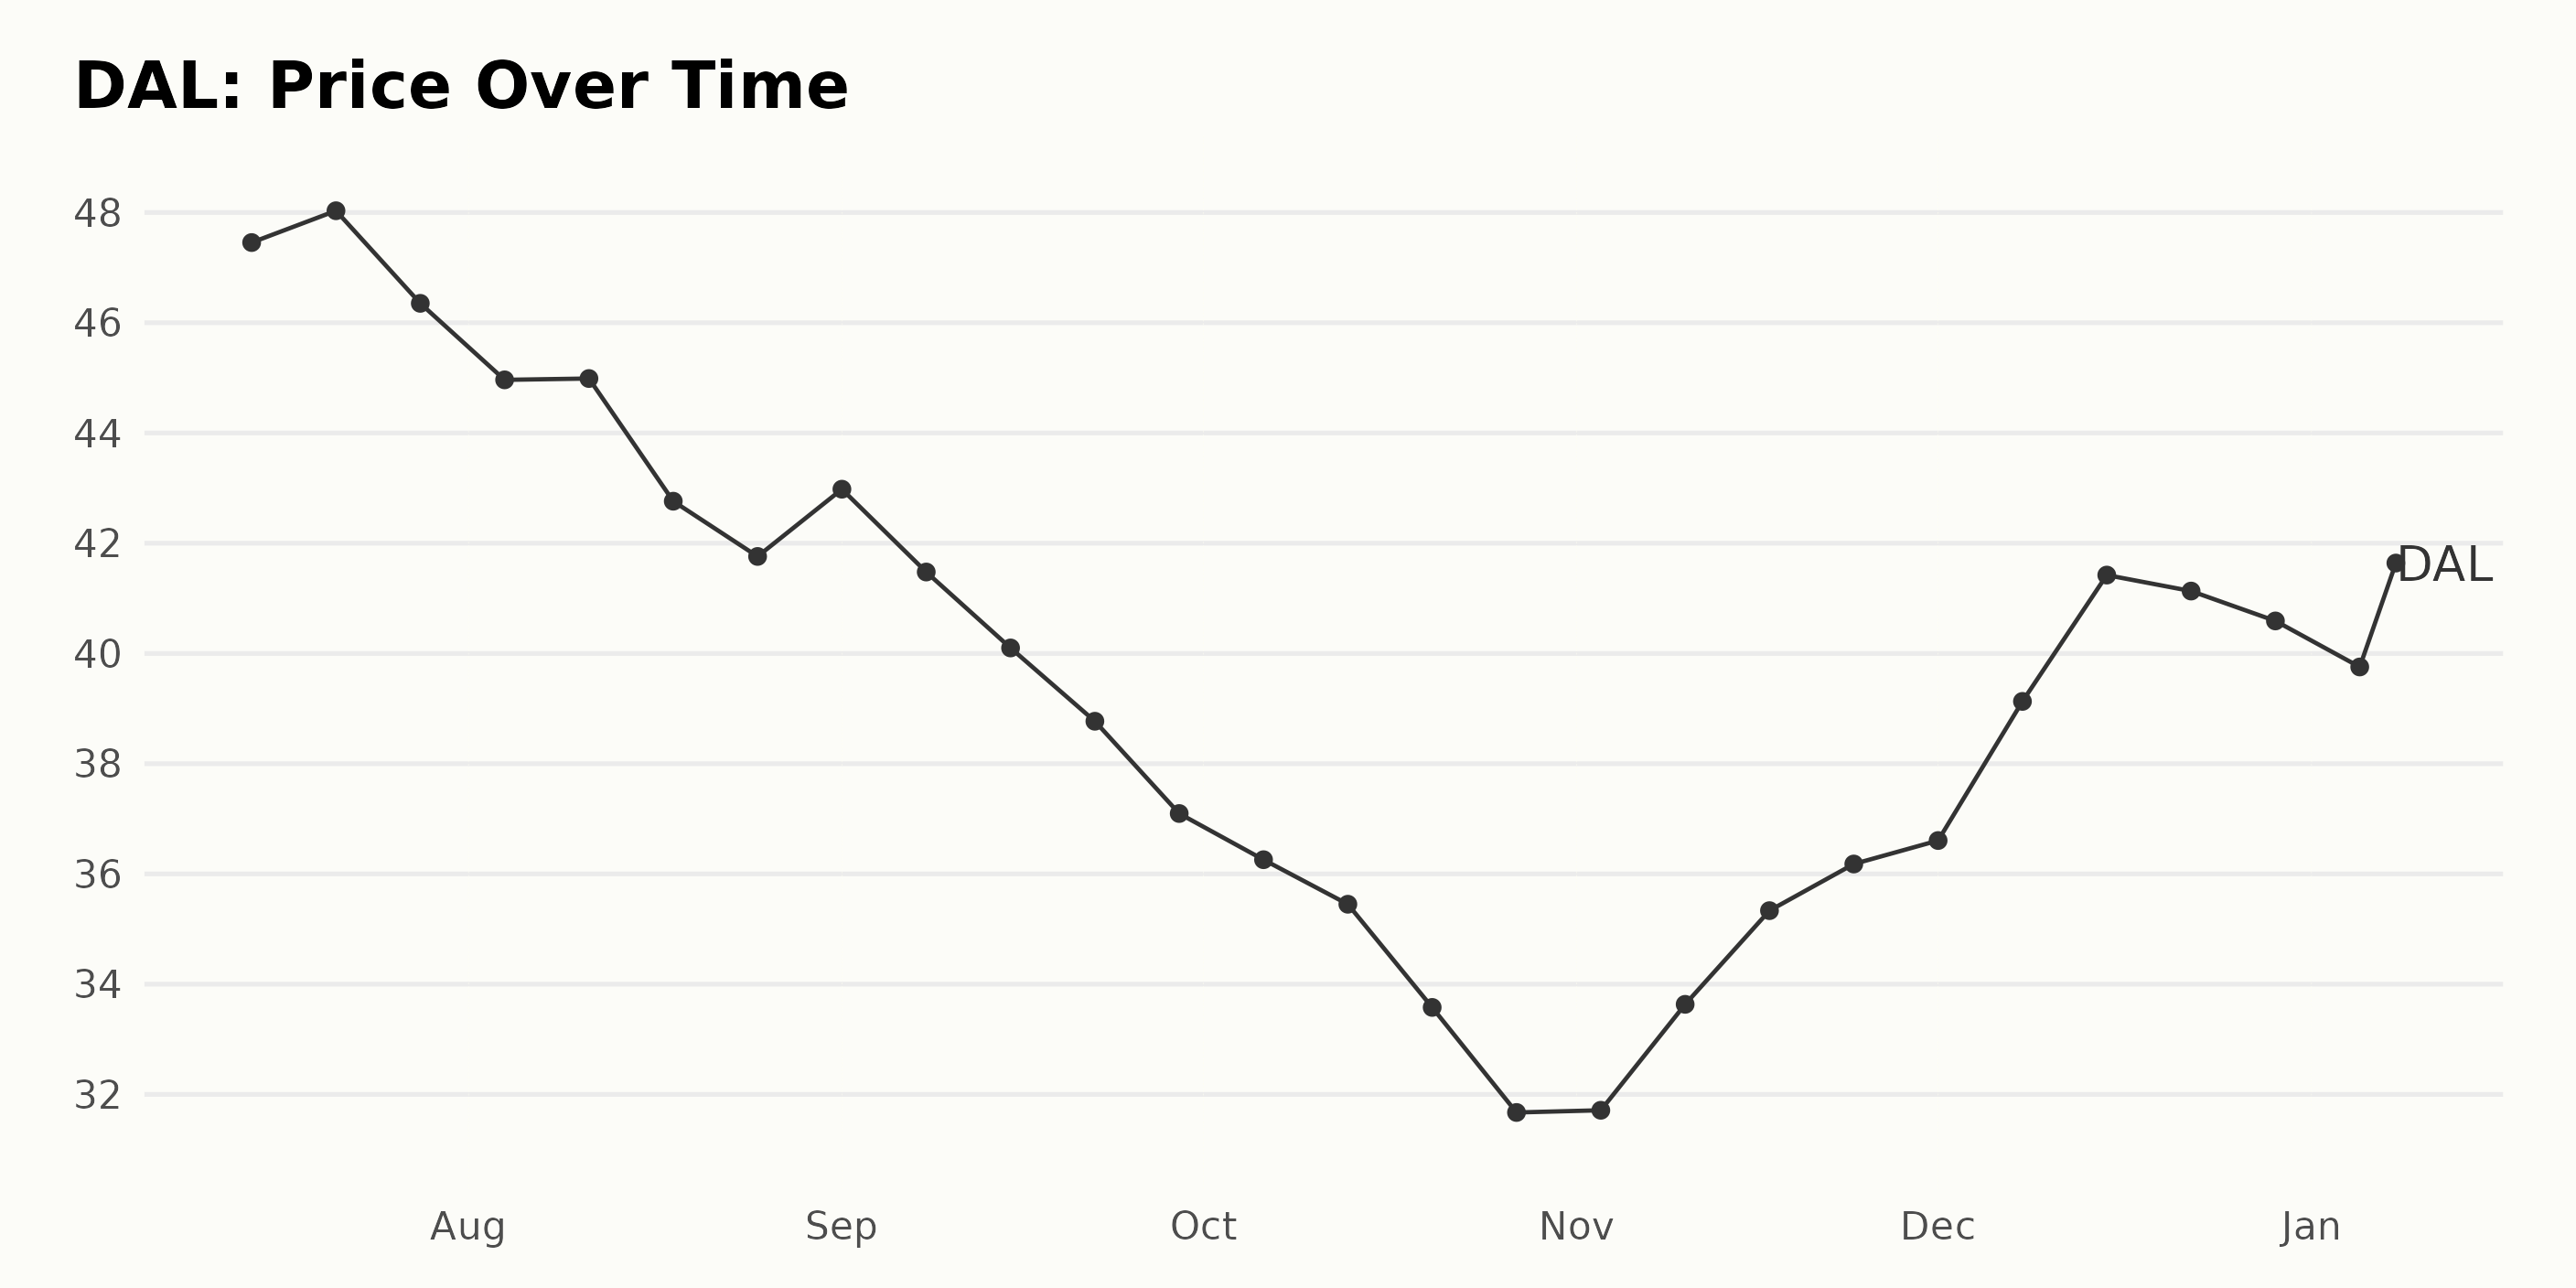
- The share price in July 2023 hovers around $47 - $48, initially rising from $47.46 on July 14, 2023, to $48.03 on July 21, 2023, before dropping to $46.35 on July 28, 2023.
- In August 2023, a decelerating trend was evident, with prices starting at $44.96 on August 4, 2023, and progressing downwards to end the month at $41.76 on August 25, 2023.
- A slight rebound is seen in early September 2023, with the price rising to $42.98 on September 1, 2023. However, this is followed by a consistent decline throughout the month, going as low as $37.10 by September 29, 2023.
- The downward trend continues into October 2023, with the price bottoming out at $31.67 on October 27, 2023.
- There is a noticeable acceleration in November 2023, with the price picking up from $31.71 on November 3, 2023, to reach $36.18 by November 24, 2023.
- Prices continue to ascend in December 2023, starting at $36.61 on December 1, 2023, and peaking at $41.42 on December 15, 2023. However, it slightly fell to $40.59 by the end of the month on December 29, 2023.
- The start of January 2024 witnessed a decrease to $39.76 on January 5, 2024, with a consequent hike to $41.63 on January 8, 2024.
From the above data, it is clear that although there have been both upward and downward trends during this period, the overall trend from July 2023 to January 2024 shows a decline (from $47.46 to $41.63). But post-October 2023, the price grew steadily with a few fluctuations. Here is a chart of DAL's price over the past 180 days.
Analyzing Delta Air Lines' Performance: Sentiment, Quality, and Value Dimensions
The POWR Ratings grade of the stock DAL, belonging to the Airlines category, has experienced varying dynamics for the period between July 2023 and January 2024.
- In July 2023, starting from the week of July 15, the POWR grade oscillated at a B (Buy) with a ranking ranging from #9 to #11 within its category.
- Then it held an almost consistent pattern up until September 23, 2023, maintaining both its B (Buy) grade and a rank fluctuating between #9 and #11.
- However, from September 23, 2023, DAL commenced experiencing drops in the POWR grade to C (Neutral) and a slight worsening in rank. This was further exacerbated by the significant drop in rank to 14th place in the week of October 21, 2023.
- These conditions seemed to stabilize somewhat in the subsequent weeks, remaining at C (Neutral) with ranking improving slightly and then staying within the #12-#13 range starting from November 18, 2023, through to the end of December 2023.
- By the first week of 2024, however, the rank slid down yet again to stand at #14 within the category.
As of the latest data point (as of January 9, 2024), the POWR grade of DAL stands at a C (Neutral). Simultaneously, its ranking within the Airlines category (which consists of 28 stocks) deteriorated to #15, indicating inferior positioning within its sector. This pattern represents a decline compared to the POWR grade and respective rank held earlier in the year.
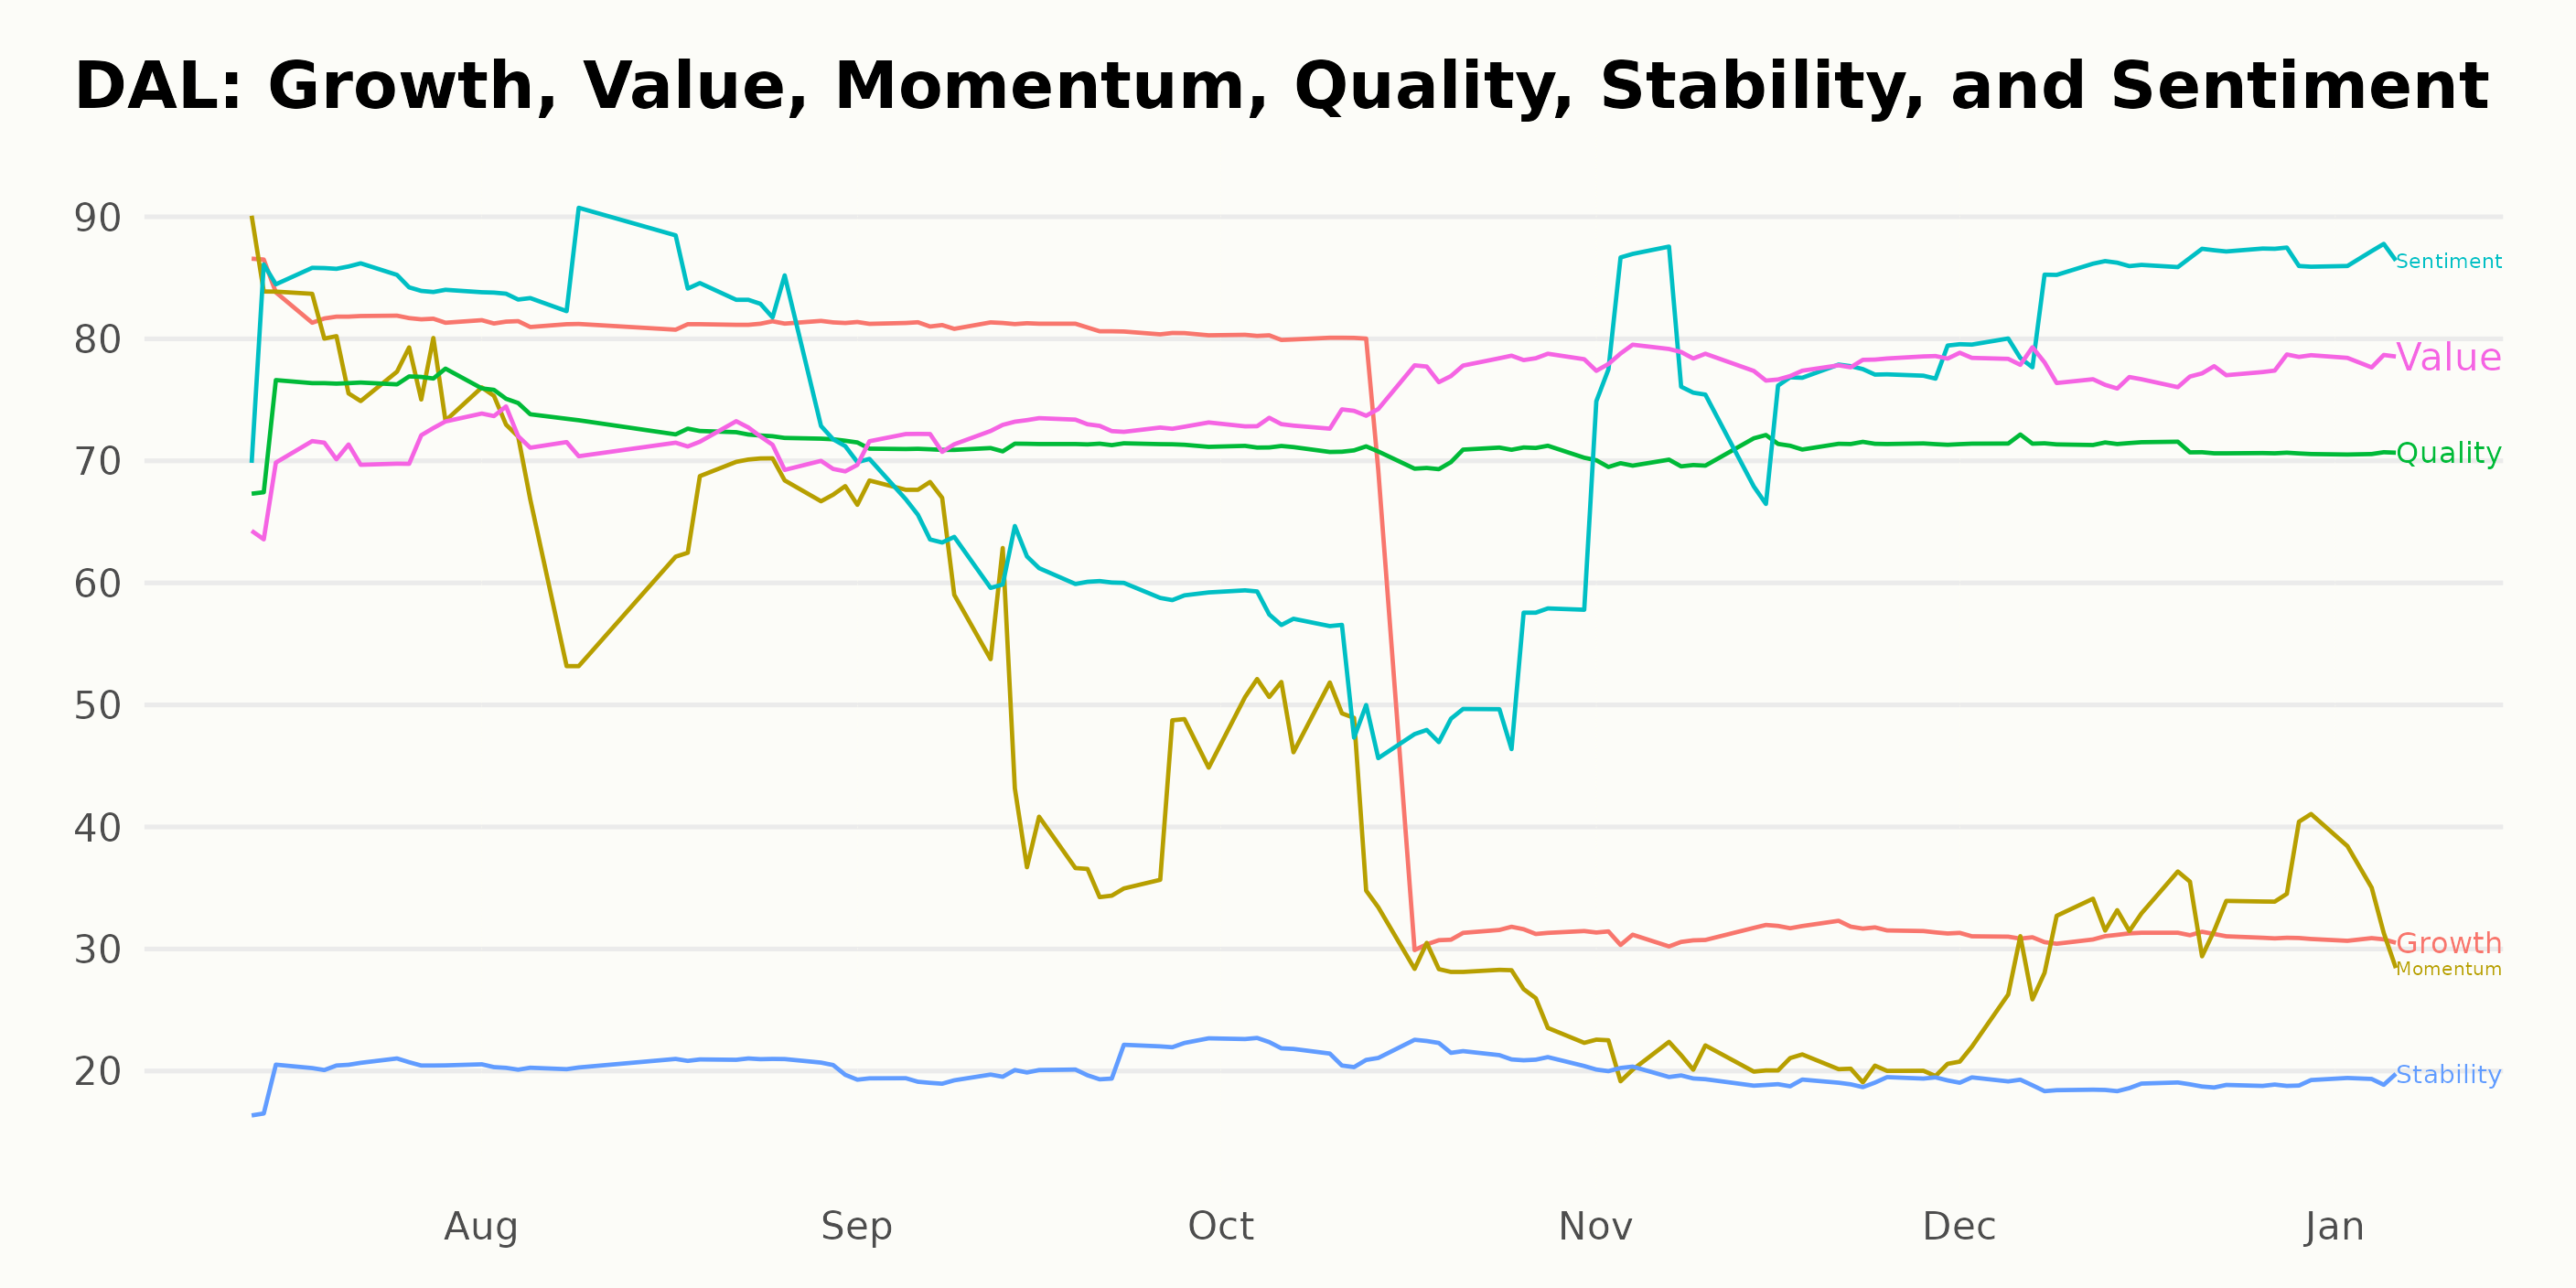
In analyzing the POWR Ratings for DAL, three dimensions appear to be the most noteworthy - Sentiment, Quality, and Value.
Sentiment: This dimension records high ratings, making it quite significant. In July 2023, the Sentiment score was at 84 points. Although there was a decrease in the following months, where the score dropped to 62 in September 2023, we observed a positive trend as the score increased progressively from 53 in October 2023 to 87 in January 2024.
Quality: Considered one of the most noteworthy dimensions for DAL’s Quality records, consistent ratings with little fluctuation. The score starts at 75 in July 2023 and shows a marginal decrease in values, settling at 71 from September 2023 through to January 2024.
Value: Value initially scored 70 in July 2023 and demonstrated an ascendant trend. Despite a slight dip in August 2023 to 72, the score increased over the ensuing months, finishing at 78 by November 2023, a score it held up until January 2024.
The data suggests a fairly positive outlook based on these parameters. However, further analysis of other factors could provide a comprehensive picture of the company's performance.
How does Delta Air Lines, Inc. (DAL) Stack Up Against its Peers?
Other stocks in the Airlines sector that may be worth considering are Cathay Pacific Airways Limited (CPCAY), Qantas Airways Limited (QABSY), and Air Canada (ACDVF) - they have better POWR Ratings. Click here to explore more Airlines stocks.
What To Do Next?
Discover 10 widely held stocks that our proprietary model shows have tremendous downside potential. Please make sure none of these “death trap” stocks are lurking in your portfolio:
DAL shares were trading at $41.87 per share on Tuesday morning, up $0.24 (+0.58%). Year-to-date, DAL has gained 4.08%, versus a -0.40% rise in the benchmark S&P 500 index during the same period.
About the Author: Anushka Dutta

Anushka is an analyst whose interest in understanding the impact of broader economic changes on financial markets motivated her to pursue a career in investment research.
The post Delta Air Lines (DAL) Pre-Earnings Momentum: Airline Stock Strategy appeared first on StockNews.com