Interactive Brokers Group, Inc. - Class A Common Stock (NQ:IBKR)
Price and Volume
Detailed Quote| Volume | 1,653,020 |
| Open | 74.35 |
| Bid (Size) | 72.27 (200) |
| Ask (Size) | 72.40 (100) |
| Prev. Close | 75.65 |
| Today's Range | 72.20 - 75.37 |
| 52wk Range | 58.95 - 98.75 |
| Shares Outstanding | 63,985,335 |
| Dividend Yield | 0.49% |
Top News
More News

Performance
52-Week Range
26.7% below 52-week high
72.33
58.9552W Low
98.7552W High
1 Week
11.9% below 1-week high
74.651W Low
82.091W High
Interactive Brokers Group, Inc. - Class A Common Stock (IBKR) traded between $58.95 and $98.75 over the past 52 weeks and last traded at $72.33, 26.7% below its 52-week high. Over the past week it ranged between $74.65 and $82.09.
Past 12 Months
1W
-$9.46
1M
-$10.58
3M
-$17.52
6M
-$11.50
YTD
+$5.10
1Y
+$7.77
IBKR was +12.0% over the past year, -13.7% over six months, +7.6% year to date, -11.6% in the last week.
12 Months vs Market
IBKR
+12.0%
DIA
+5.8%
SPY
+6.1%
QQQ
+3.9%
IWM
+11.6%
Over the past 12 months IBKR returned +12.0% versus DIA (Dow) +5.8%, SPY (S&P 500) +6.1%, QQQ (Nasdaq 100) +3.9% and IWM (Russell 2000) +11.6%.
Volume & Liquidity
0.38× 3-mo avg
Today 1,653,020
3-mo avg 4.3M
1W
3.4M
1M
5.0M
3M
4.3M
6M
4.6M
YTD
4.7M
1Y
4.6M
IBKR most recently traded 1,653,020 shares against a 3-month average daily volume of 4.3M.
More News
Read More
Why Am I Downgrading This Hall of Fame Stock? ↗
November 19, 2026

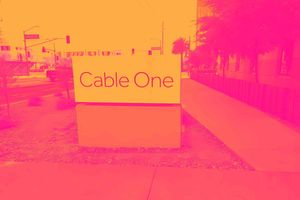
Why Cable One (CABO) stock is falling today
November 06, 2026







Is Robinhood Stock a Buy About a Third Below Its Record High? ↗
October 26, 2026

Interactive Brokers Introduces Autonomous Trading
October 21, 2026
Interactive Brokers: 3 Key Takeaways for Long-Term Investors ↗
October 18, 2026
Interactive Brokers (IBKR) Q3 2026 Earnings Call Transcript ↗
October 16, 2026



Interactive Brokers Group Q3 Earnings Call Highlights ↗
October 15, 2026
Frequently Asked Questions
Is Interactive Brokers Group, Inc. - Class A Common Stock publicly traded?
Yes, Interactive Brokers Group, Inc. - Class A Common Stock is publicly traded.
What exchange does Interactive Brokers Group, Inc. - Class A Common Stock trade on?
Interactive Brokers Group, Inc. - Class A Common Stock trades on the Nasdaq Stock Market
What is the ticker symbol for Interactive Brokers Group, Inc. - Class A Common Stock?
The ticker symbol for Interactive Brokers Group, Inc. - Class A Common Stock is IBKR on the Nasdaq Stock Market
What is the current price of Interactive Brokers Group, Inc. - Class A Common Stock?
The current price of Interactive Brokers Group, Inc. - Class A Common Stock is 72.33
When was Interactive Brokers Group, Inc. - Class A Common Stock last traded?
The last trade of Interactive Brokers Group, Inc. - Class A Common Stock was at 11/20/26 11:44 AM ET
What is the market capitalization of Interactive Brokers Group, Inc. - Class A Common Stock?
The market capitalization of Interactive Brokers Group, Inc. - Class A Common Stock is 4.63B
How many shares of Interactive Brokers Group, Inc. - Class A Common Stock are outstanding?
Interactive Brokers Group, Inc. - Class A Common Stock has 5B shares outstanding.