Athletic footwear and apparel powerhouse NIKE, Inc. (NKE) enjoys robust profitability. In terms of its trailing-12-month net income margin and Return On Common Equity (ROCE), NKE’s 9.90% and 34.6% are 124.2% and 216.7% higher than the industry averages of 4.42% and 10.93%, respectively.
Earlier this month, NKE declared a quarterly dividend of $0.34 per share on its outstanding Class A and Class B common stock, payable to shareholders on October 2, 2023. Its $1.36 annual dividend yields 1.34% on prevailing prices.
The company has grown its dividend payouts for ten consecutive years. In addition, its dividends have grown at CAGRs of 11.5% and 11.2% over the past three and five years, respectively.
However, the company’s stock has come under significant pressure lately due to possible reasons such as selective consumer spending and an uneven recovery in China, where NKE conducts a third of its business.
NKE also had a rare earnings miss in the last reported quarter (ended May 31, 2023). Its 66 cents EPS was lower than the analyst estimate of 67 cents.
Given this backdrop, let’s look at the trends of NKE’s financial metrics to understand why it could be wise to wait for a better entry point in the stock.
Exploring NIKE, Inc.'s Financial Performance: A Detailed Examination from 2020 to 2023
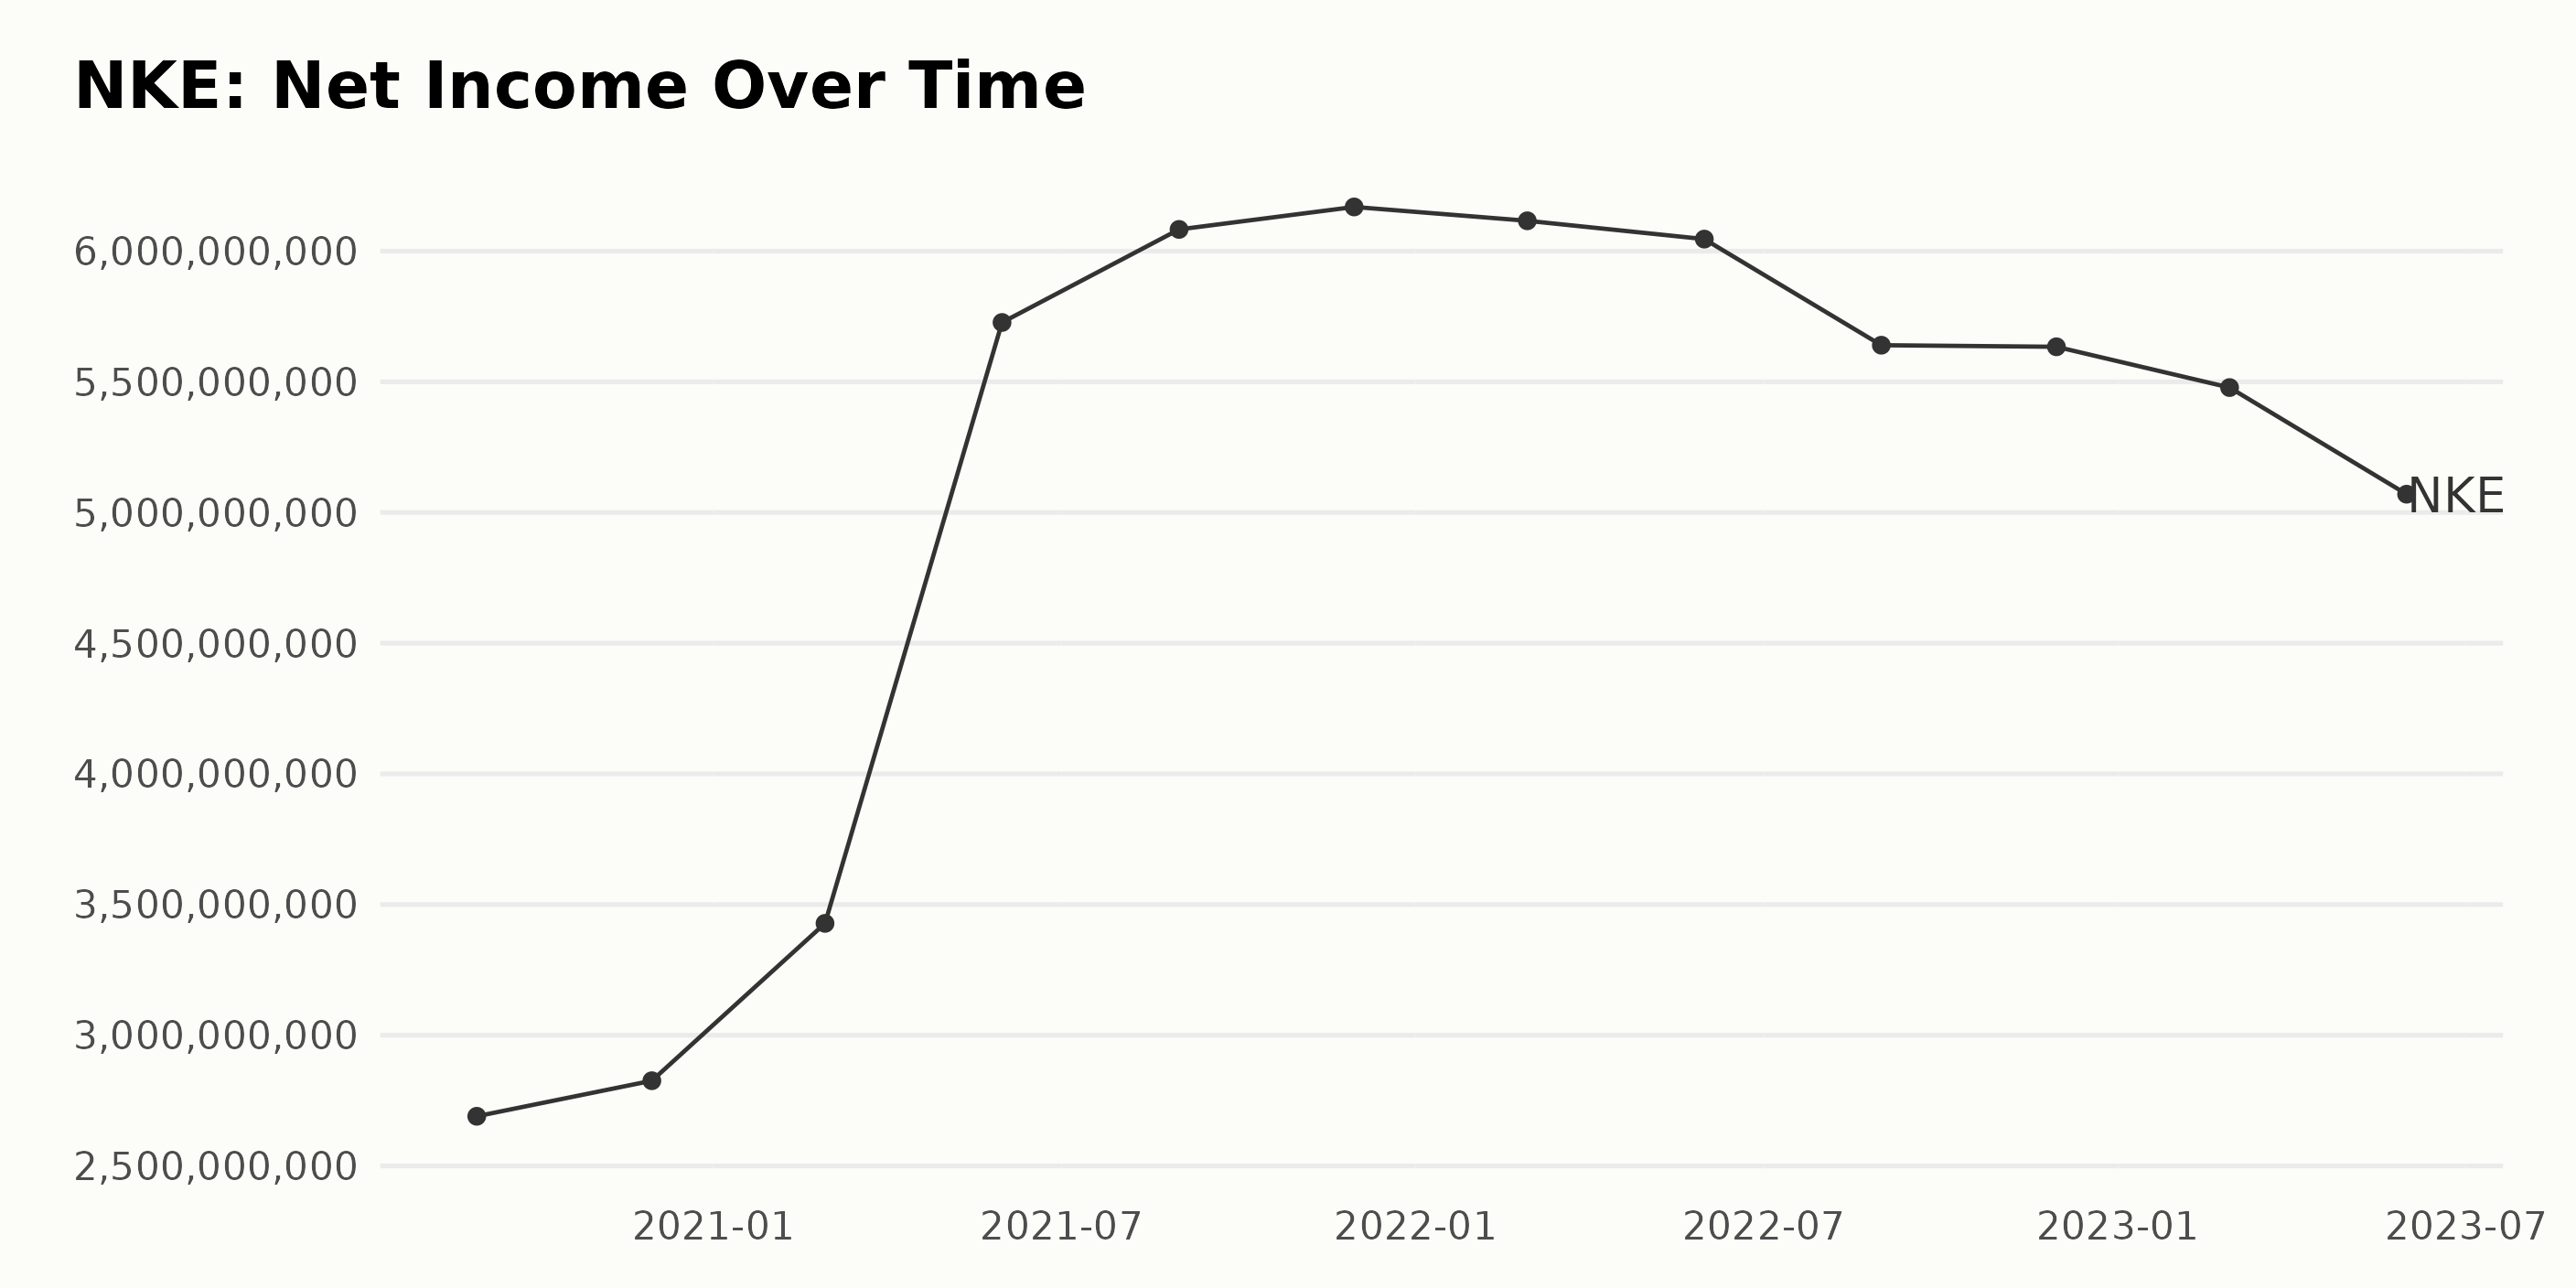
The trailing-12-month net income of NKE displayed a general upward trajectory from August 2020 to November 2021, with some fluctuations over the period of data.
- In August 2020, the net income stood at $2.69 billion.
- The net income rose incrementally through November 2020 ($2.83 billion) and February 2021 ($3.43 billion).
- A significant jump was seen by May 2021, when the net income peaked at $5.73 billion.
- From May 2021 onwards, the net income experienced further growth, hitting its highest point in November 2021 at $6.17 billion. However, from November 2021 on, the net income gradually declined.
- In February 2022, it was slightly lower at $6.12 billion.
- Thereafter, the net income continued its downward trend until May 2023 ($5.07 billion), with some minor fluctuations in between.
From the first value in August 2020 ($2.69 billion) to the last value in May 2023 ($5.07 billion), the overall growth rate of the net income is approximately 88.48%.
It's important to note that while there was a general increase during much of this period, the more recent data, particularly from November 2021 to May 2023, shows a steady net income decrease. The emphasis should be on the more recent trend of decline in the net income of NKE.
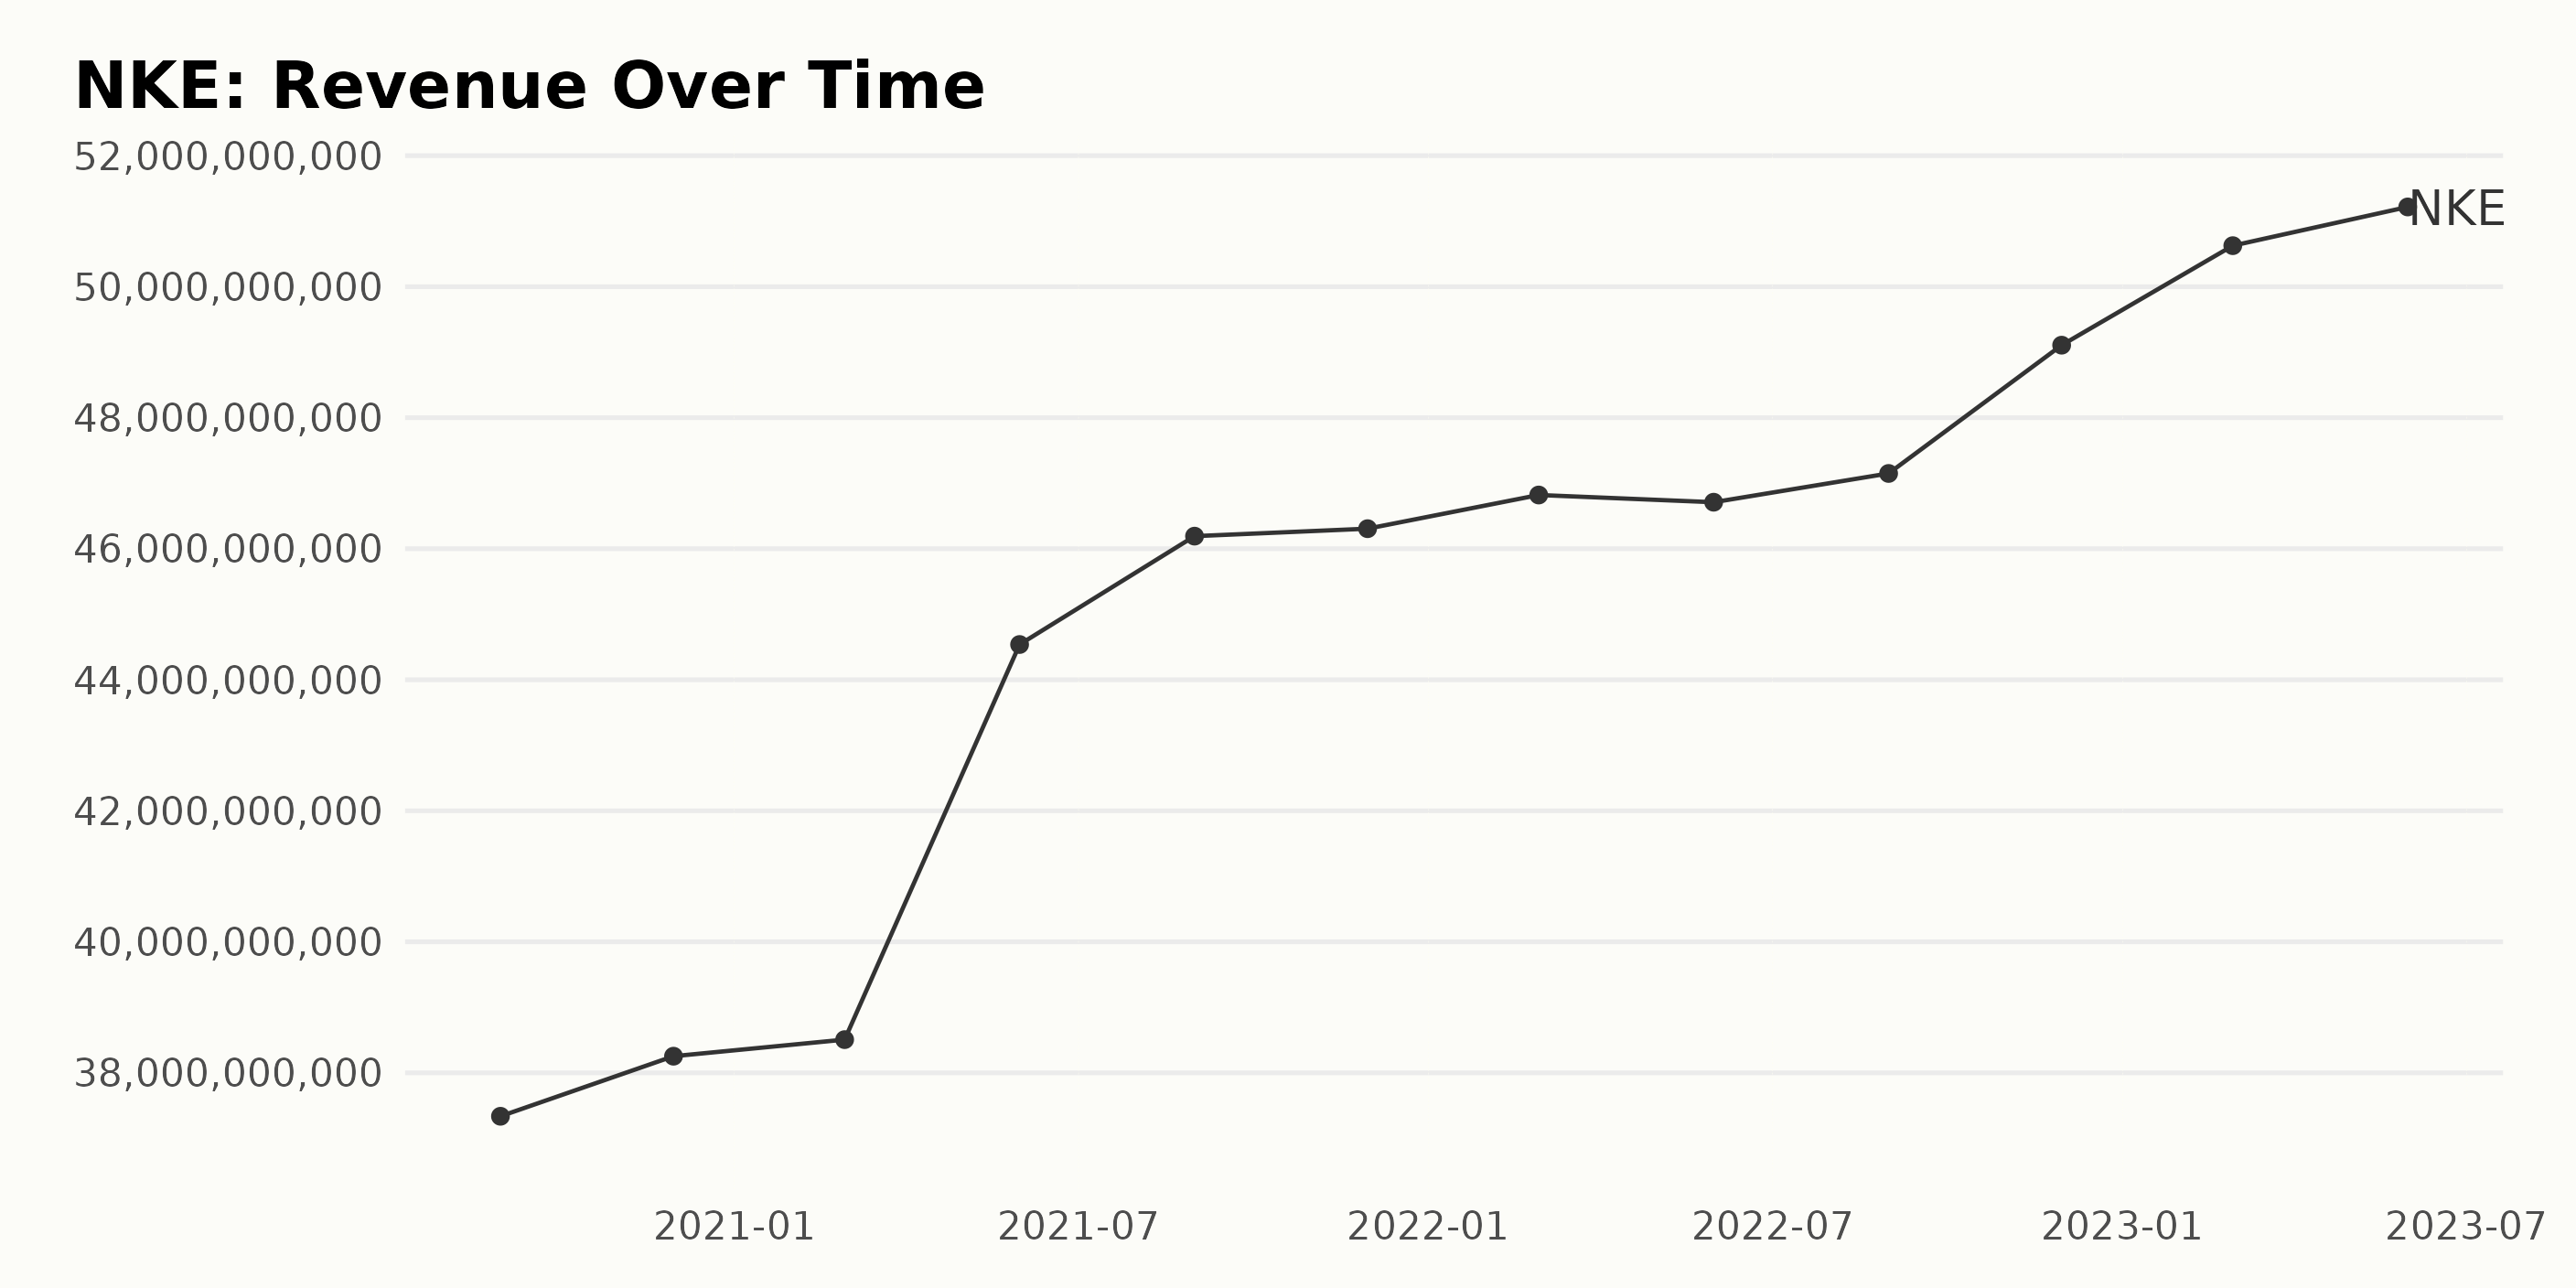
The trend and fluctuations of NKE’s trailing-12-month revenue over the years can be observed as follows:
- On August 31, 2020, NKE's revenue was approximately $37.34 billion.
- By November 30, 2020, a slight increase was seen, and the revenue reached $38.25 billion.
- This incremental trend continues through February 28, 2021, where the revenue is recorded as $38.51 billion.
- In May 2021, a significant jump in revenue was observed, where it scaled up to $44.54 billion.
- From August 2021 to November 2021, the revenue witnessed minor hikes and plateaus at $46.31 billion.
- However, by February 2022, the revenue increased again, pegged at $46.82 billion.
- Interestingly, NKE's Revenue experienced a bit of a downturn by May 31, 2022, marking $46.71 billion.
- August 2022 recorded a slight recovery to $47.15 billion.
- The revenue then increased to $49.11 billion in November 2022, revealing another major surge.
- Year 2023 continued this upward trend. As of February 28, 2023, NKE's revenue stood at $50.63 billion, which further escalated to $51.22 billion by May 31, 2023.
Overall, NKE's revenue has experienced steady growth with some minor fluctuations over the period. From the initial reported value of $37.34 billion on August 31, 2020, to the last reported value of $51.22 billion on May 31, 2023, the growth rate is calculated to be around 37.3%. This exhibits a considerable increase in revenue over the reported timeframe.
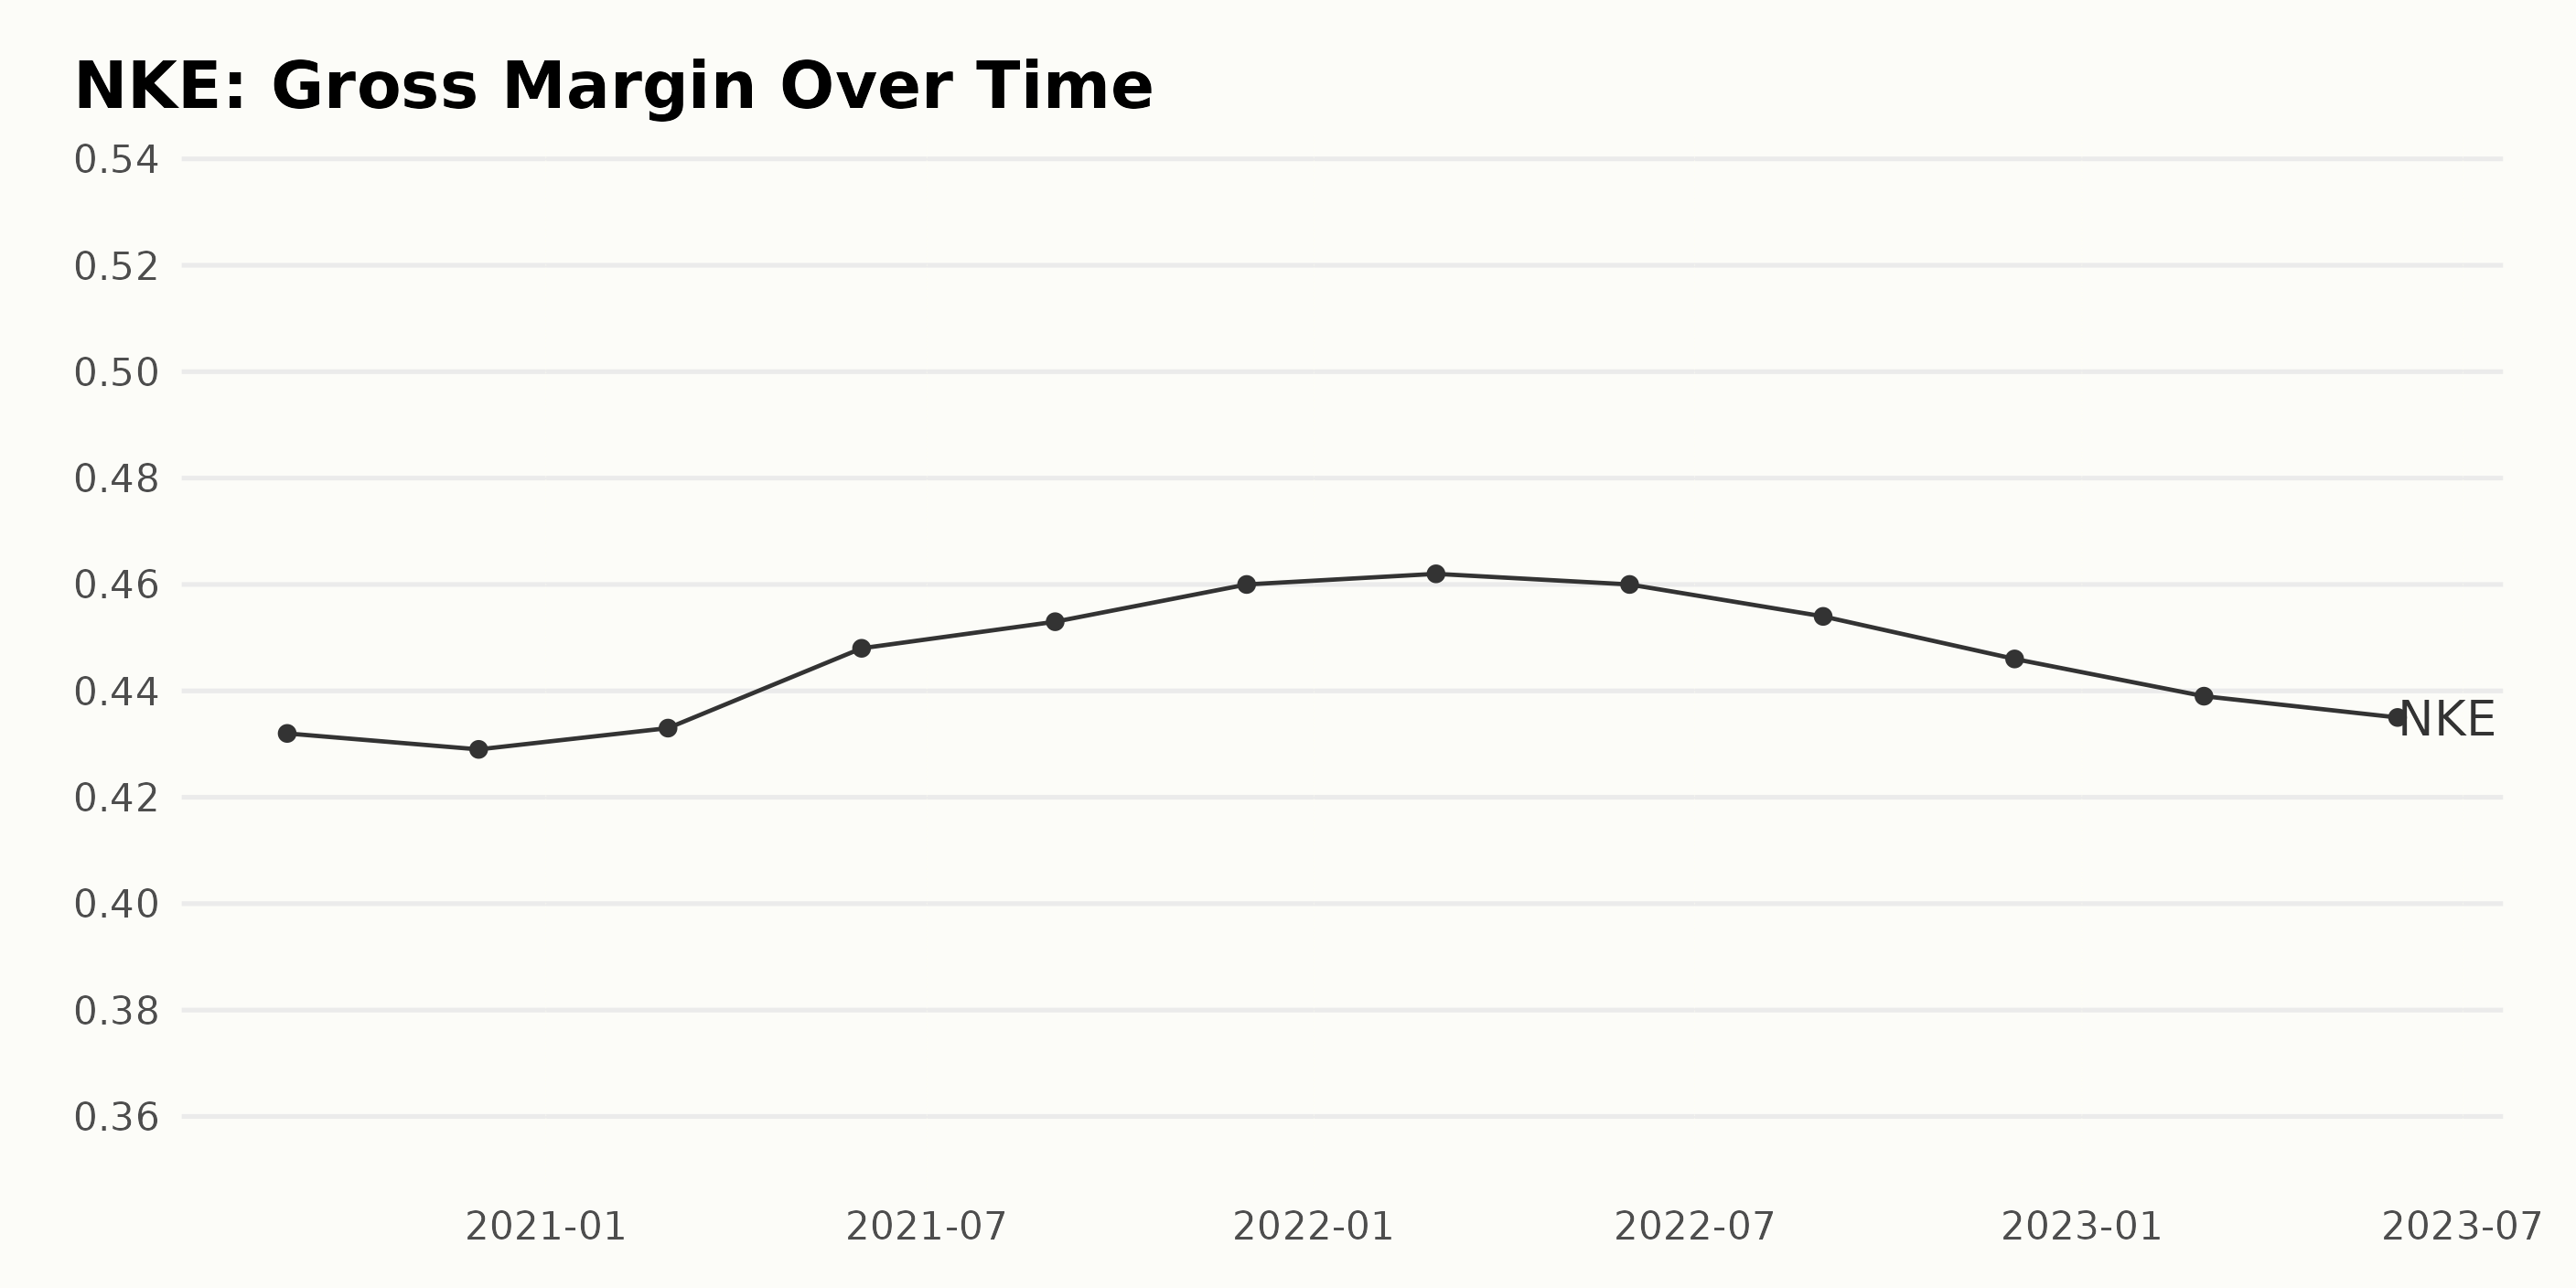
The gross margin of NKE exhibits moderate fluctuations over the timeline, ranging from August 2020 through May 2023.
- In August 2020, the company's gross margin stood at 43.2%.
- This figure slightly declined to 42.9% by November 2020.
- From February 2021 onwards, a slightly positive trend can be discerned, with the gross margin value recovering to 43.3% and slowly increasing to 44.8% by May 2021.
- The positive trend continued until February 2022, as the gross margin reached its peak at 46.2%.
- However, following May 2022, the margin seems to decline gradually with slight month-to-month fluctuations, falling to 43.5% by May 2023.
Calculating the growth rate from August 2020 to May 2023 shows a slight increment of 0.3%. This percentage increase signifies that while there were fluctuations, the net change over time indicates a minor improvement in the company's gross margins.
Given the greater emphasis on more recent data, it's worth noting that from 2022 to 2023, there has been a marked decrease. However, the foremost element to point out is the apparent decline in gross margin from 46.2% in February 2022 to 43.5% by May 2023. This represents a 2.7% decrease, which could be significant for investors and stakeholders.
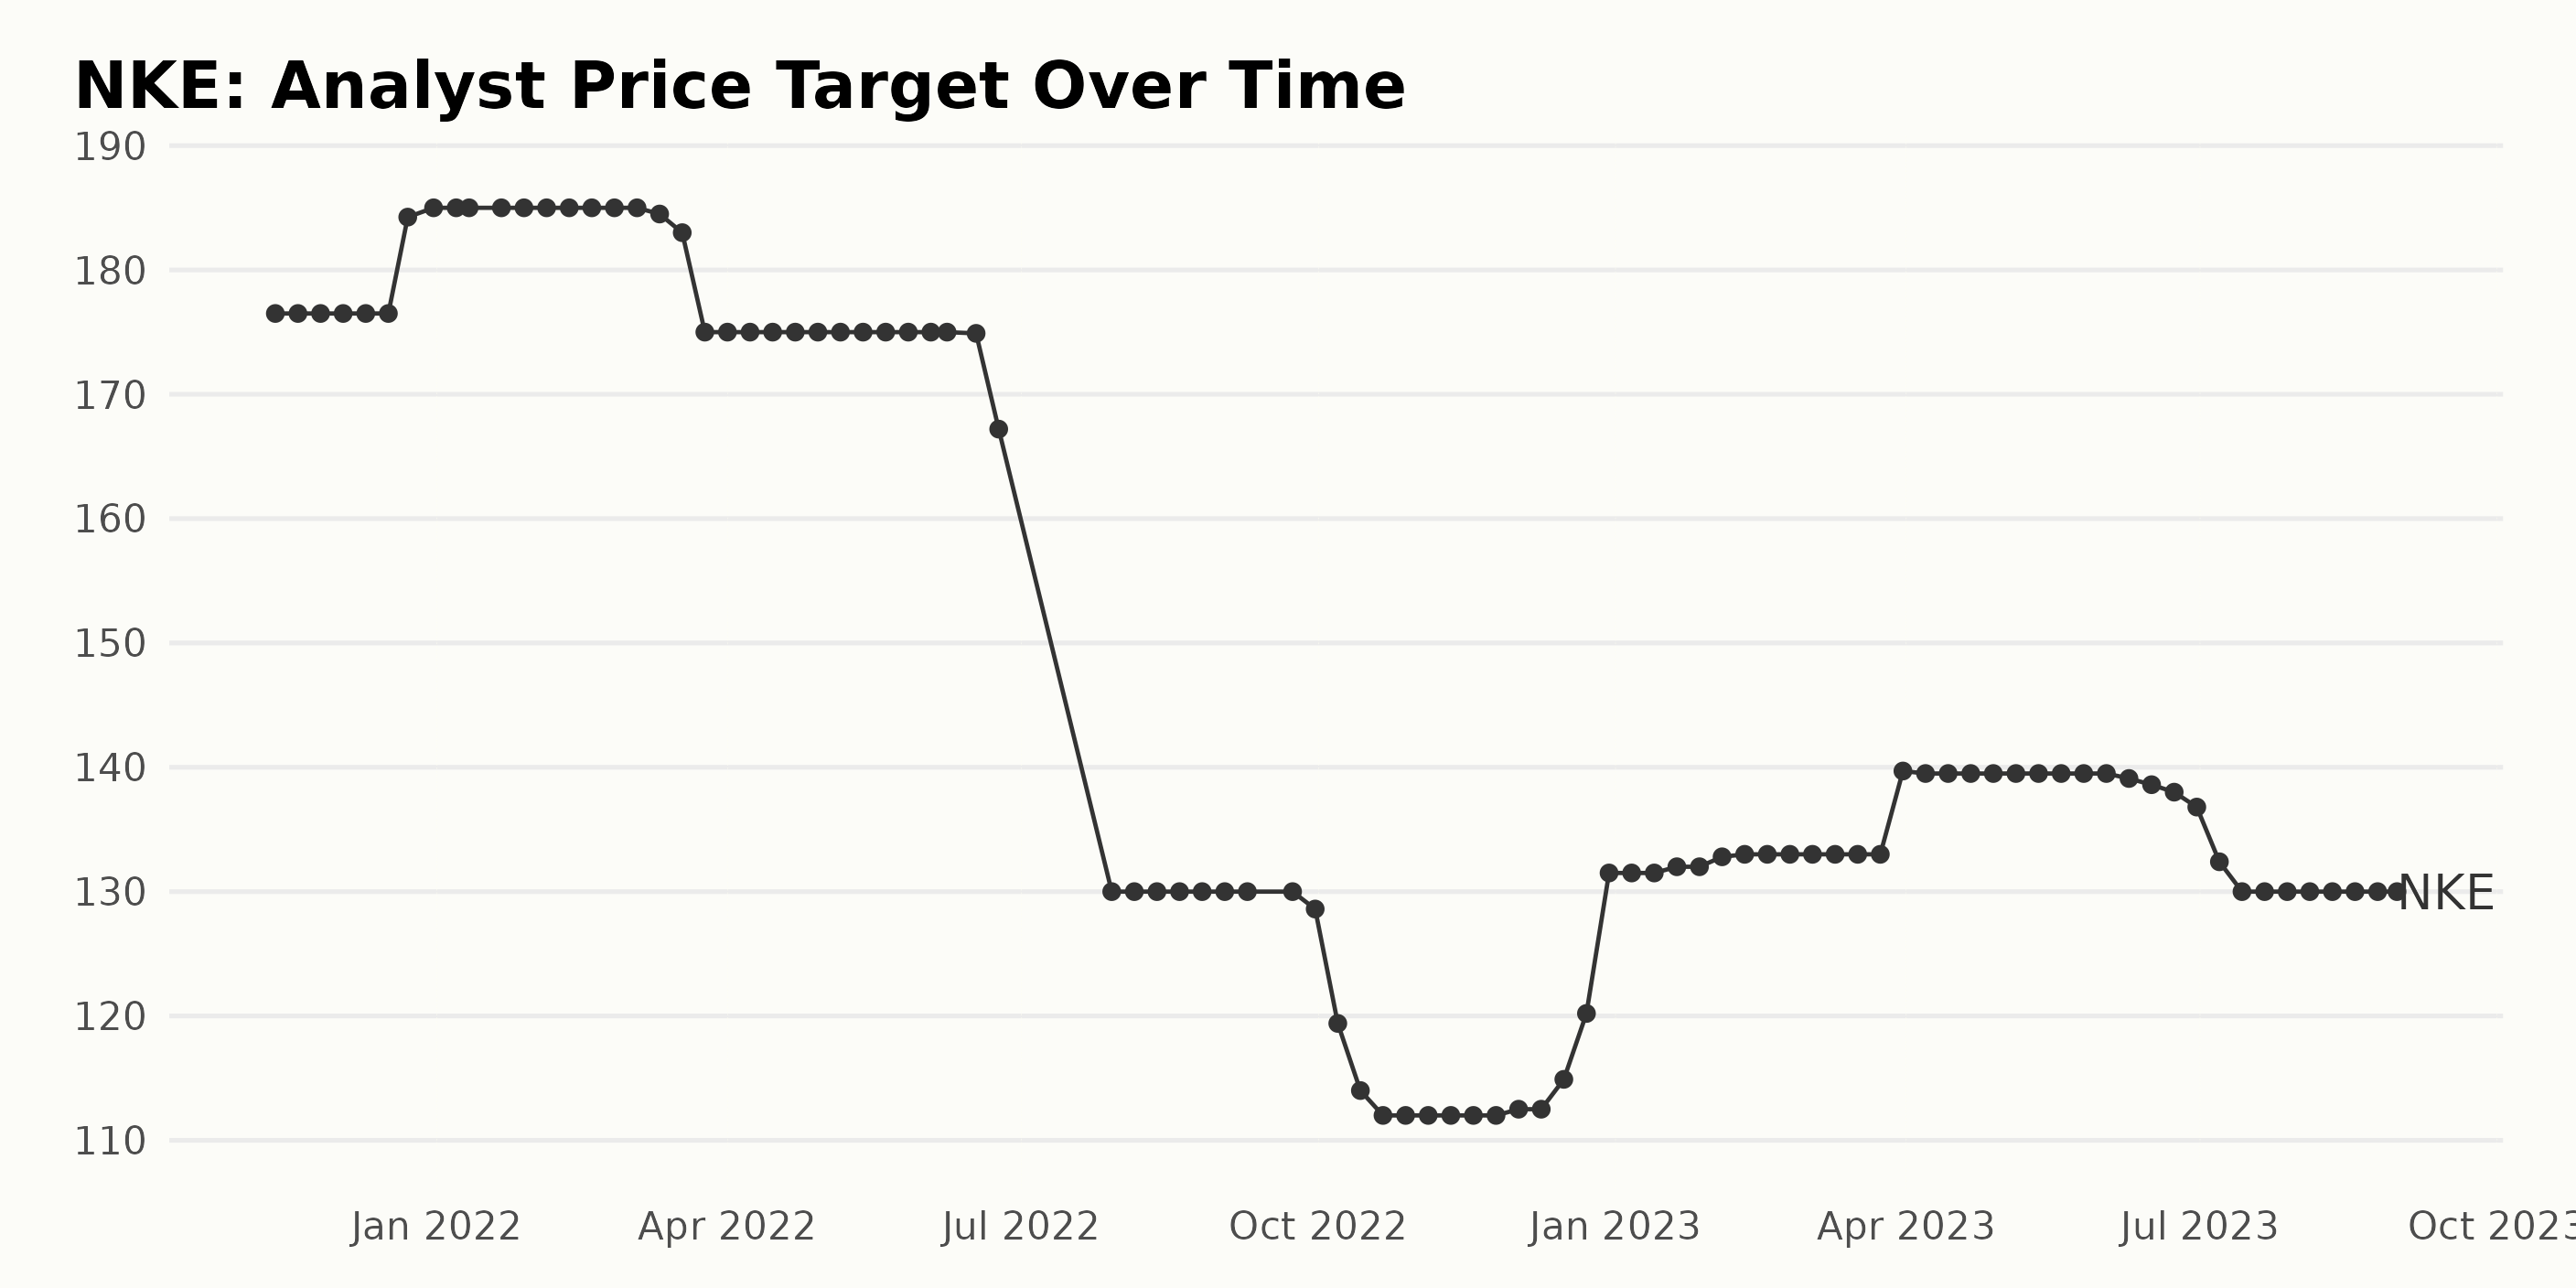
The analyst price target for NKE has seen considerable changes over the period spanning from November 2021 to August 2023. Key points from the data:
- The price target experienced consistency at $176.5 from November 2021 till mid-December 2021 before observing a slight increase.
- From December 23, 2021, a sharp rise began, reaching a peak of $185 on December 31, which was stable through mid-March 2022.
- This was followed by a sharp decline, with the lowest point at $130 recorded in late July 2022; this value remained steady until late September 2022.
- The target then fell further to a low of $112 by mid-November 2022, where it remained fairly consistent, with a slight increase toward the end of December.
- The year 2023 began with an upward trend and remained around $132 till late February.
- From March 31, 2023, there was another surge, with the value rising to $139.7 and maintained around $139.5 until early June.
- After June 9, 2023, the price target steadily declined to reach $130 again by mid-July 2023 and remained there until the last data point on August 31, 2023.
Growth rate: Examining the first and last values in the series, the analyst price target value was $176.5 on November 12, 2021, and ended on August 31, 2023, at $130. This represents a decrease of approximately -26%. Recent data indicates a consistent analyst price target of $130.
NIKE Share Price: A Six-Month Analysis on Rising, Falling, and Resilience in 2023
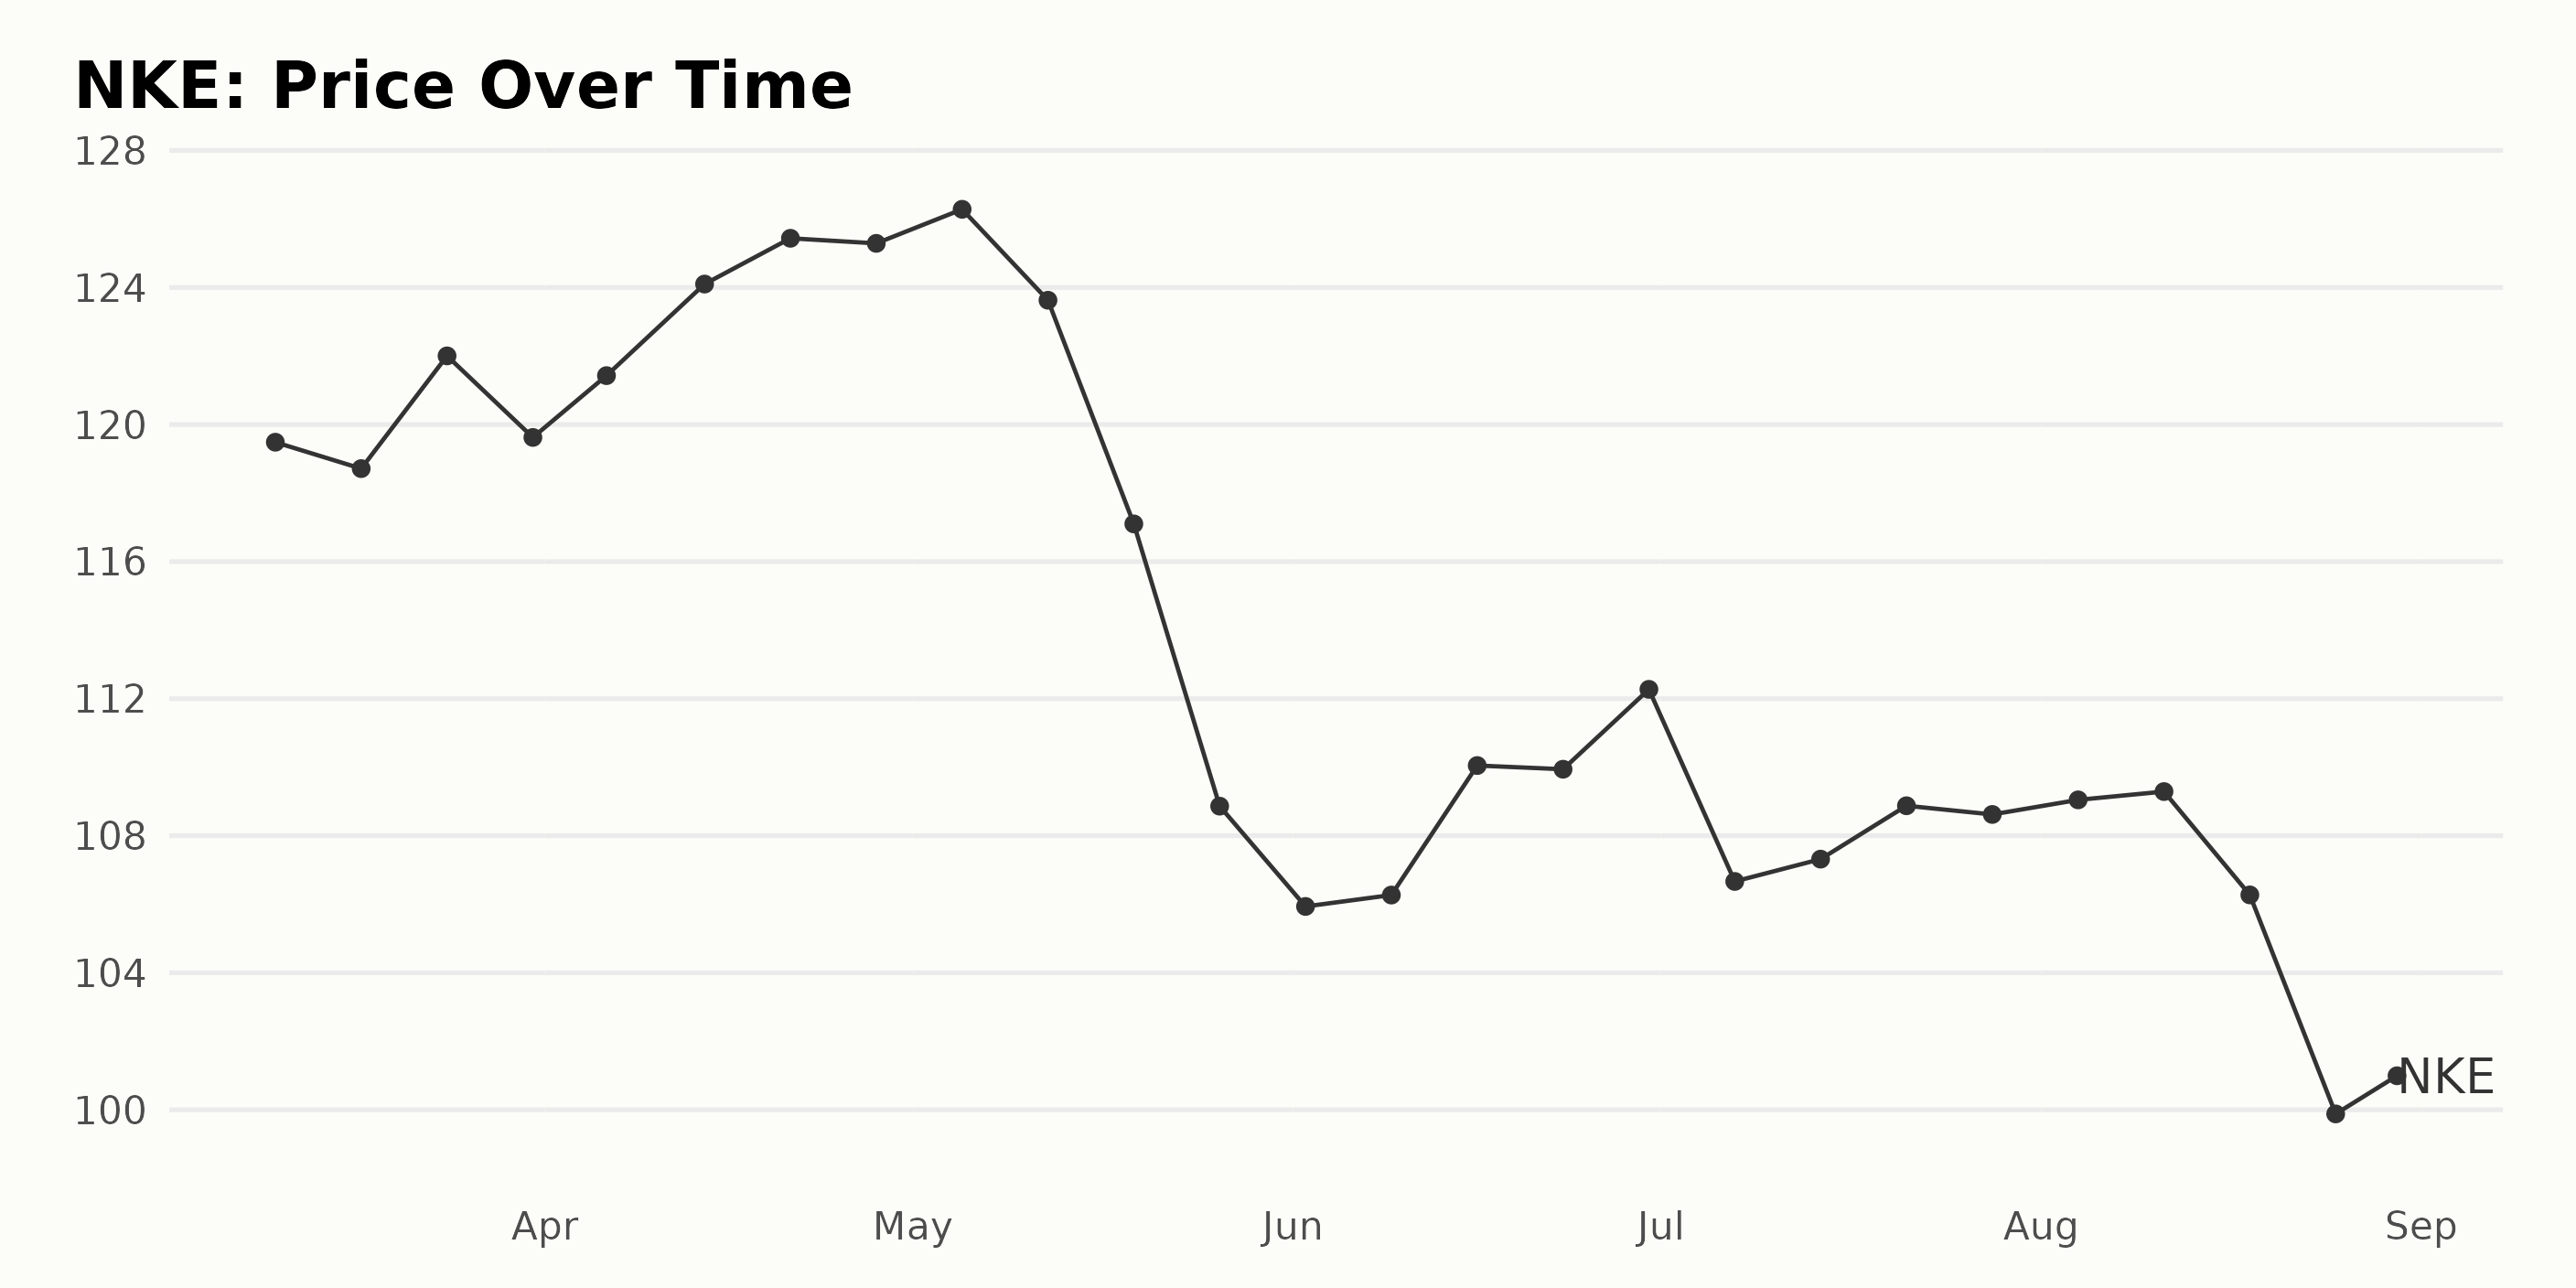
Upon analysis of the supplied data representing NKE share prices between March and August 2023, several discernible trends exist.
From March 10, 2023, at $119.48, to April 21, 2023, with a peak at $125.44, there is a general upward trend in the share price of NKE. This shows an increase in value over approximately a month and a half.
However, starting from May 5, 2023, when it was at its highest of $126.28, the price began to decline steadily, reaching its lowest at $99.88 on August 25, 2023.
While an overall negative trend or reduction can be identified, it is not a straight fall. The data shows cyclical variations alongside the general trend, with minor rises and falls in share prices throughout the time period. For example, there is a slight rise from June 2, 2023 ($105.94), reaching $112.27 on June 30, 2023. However, the overarching downward trend resumes after this.
The difference in share price from March 10, 2023 ($119.48) to August 30, 2023 ($102.10) shows a significant decrease over the course of around six months. NKE's share price experienced an initial period of growth followed by an extended decelerating trend over the six-month period in 2023.
This decline does show some resistance with minor regrowth periods, but the overarching downward trajectory persisted. Here is a chart of NKE's price over the past 180 days.
Analyzing NIKE, Inc.'s Quality, Stability, and Sentiment POWR Ratings (March-August 2023)
The POWR Ratings grade of NKE, a stock categorized under Athletics & Recreation, has been consistently marked with a grade C (Neutral) from March 4, 2023, to August 31, 2023.
Within this timeframe, its rank within the category fluctuated, generally maintaining a place around the lower third of the total 36 stocks in the category. Here's a snapshot of some key dates:
- As of March 4, 2023: The POWR grade was C (Neutral), and the rank in the category was #13.
- As of April 1, 2023: The POWR grade remained C (Neutral), and the rank in category worsened slightly to #14.
- As of May 6, 2023: The POWR grade was still C (Neutral), but the rank in category improved to #10.
- As of July 1, 2023: The POWR grade was C (Neutral), and NKE held onto its rank of #10 within the category.
- As of August 5, 2023: The POWR grade was C (Neutral), ranking in category slipped to #15.
- As of August 31, 2023: The POWR grade is still C (Neutral), with a rank in category at #13.
It's clear that while NKE's POWR grade has remained stable, its rank in the category continuously fluctuates, denoting some inconsistency in its standing within the Athletics & Recreation category when compared to other stocks.
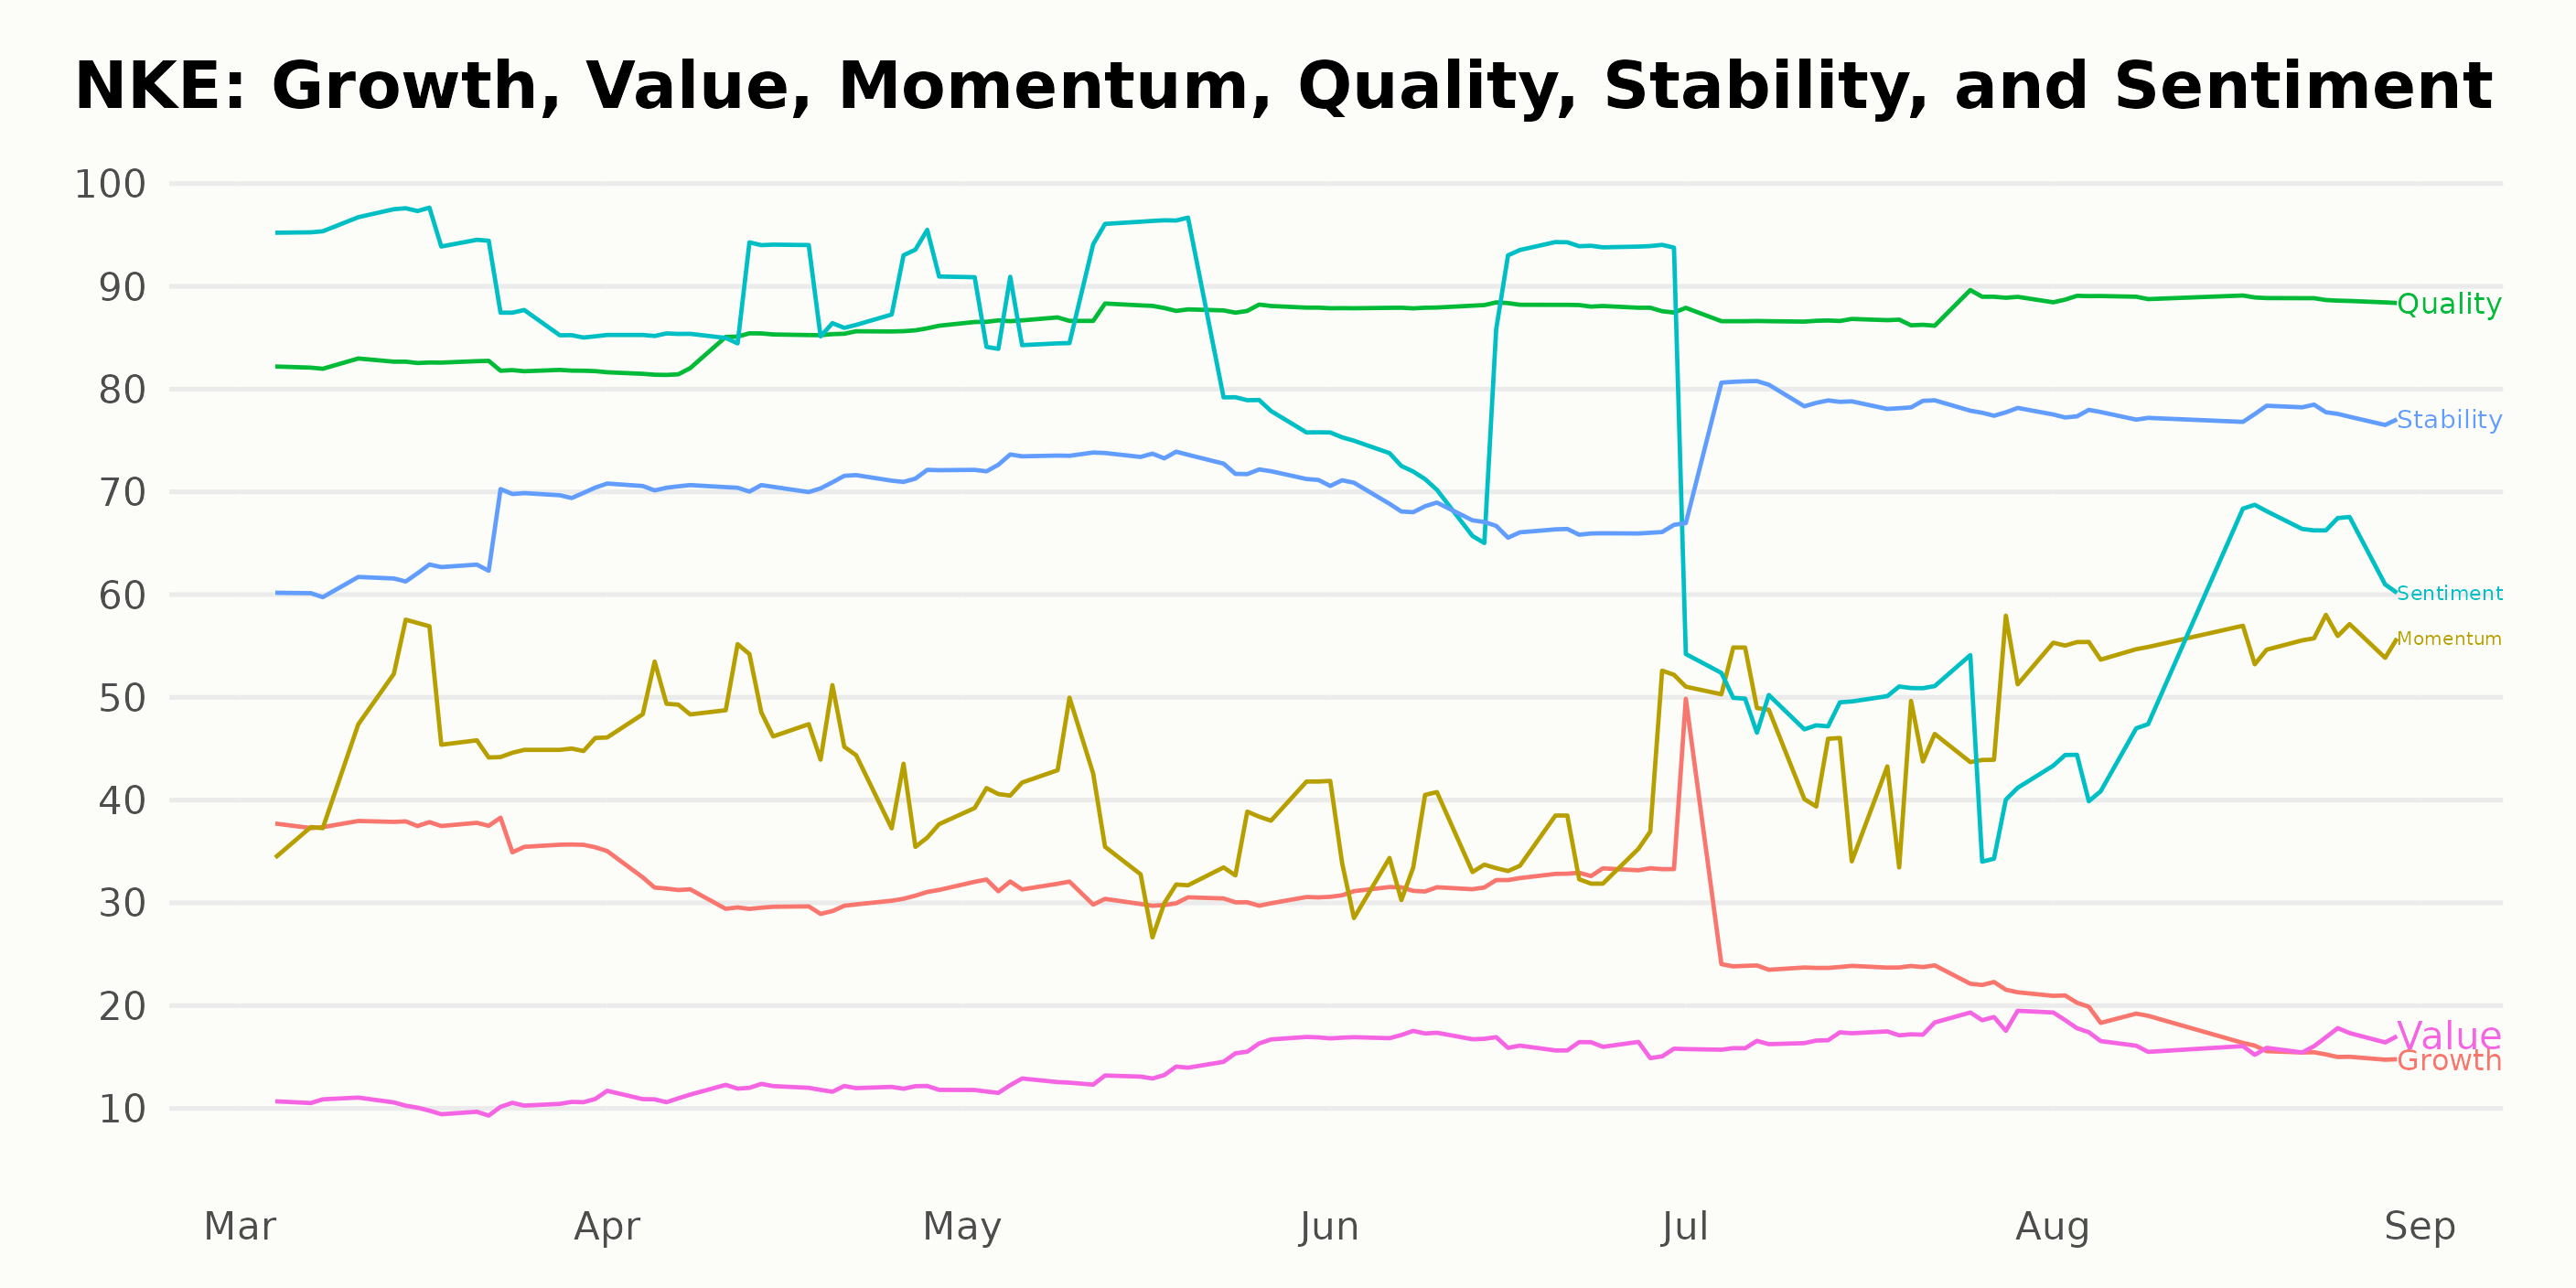
For NKE, the most noteworthy POWR ratings dimensions are Quality, Sentiment, and Stability based on their relatively high values compared to Growth, Momentum, and Value dimensions. The specific trends and ratings for these three dimensions over time are as follows:
Quality: The Quality dimension tends to have a high rating consistently throughout the months. It started at 82 in March 2023 and showed a gradual climbing trend, reaching 89 by August 2023. This suggests that NKE has shown consistent quality over the observed period.
- March 2023: 82
- April 2023: 84
- May 2023: 87
- June 2023: 88
- July 2023: 87
- August 2023: 89
Sentiment: The Sentiment dimension began at a high of 92 in March 2023 but shows a somewhat volatile trend. Although it dropped to 83 by June 2023, it displayed considerable variation, with drastic reductions to 48 in July and a gradual recovery to 57 in August 2023.
- March 2023: 92
- April 2023: 89
- May 2023: 87
- June 2023: 83
- July 2023: 48
- August 2023: 57
Stability: The Stability dimension showed a predominantly upward trend from March to August 2023, reflecting a rising Stability level. Starting at 65 in March 2023, it achieved its highest rating of 78 in July and August 2023.
- March 2023: 65
- April 2023: 71
- May 2023: 73
- June 2023: 67
- July 2023: 78
- August 2023: 78
In conclusion, over the period from March to August 2023, NKE presented strong Quality and Stability ratings, while the Sentiment fluctuated but remained significant in the POWR ratings.
How does NIKE, Inc. (NKE) Stack Up Against its Peers?
Other stocks in the Athletics & Recreation sector that may be worth considering are Marine Products Corporation (MPX), American Outdoor Brands, Inc. (AOUT), and Skechers U.S.A., Inc. (SKX) - they have better POWR Ratings. For exploring more Athletics & Recreation stocks, click here.
43 Year Investment Pro Shares Top Picks
Steve Reitmeister is best known for his timely market outlooks & unique trading plans to stay on the right side of the market action. Click below to get his latest insights…
Steve Reitmeister’s Trading Plan & Top Picks >
NKE shares were trading at $102.09 per share on Thursday morning, down $0.01 (-0.01%). Year-to-date, NKE has declined -12.21%, versus a 19.04% rise in the benchmark S&P 500 index during the same period.
About the Author: Anushka Dutta

Anushka is an analyst whose interest in understanding the impact of broader economic changes on financial markets motivated her to pursue a career in investment research.
The post Is NIKE (NKE) a Buy or Hold for September? appeared first on StockNews.com