One of the great ironies of technical analysis is that its practitioners claim to uncover patterns that probabilistically perform better than random chance would suggest — yet they seem completely oblivious to the greatest meta signal of them all. It’s no wonder, then, that the quantitative approach is rapidly disrupting the old guard in the financial publication industry.
In prior generations, technical analysis — or the study of price behaviors to make trading and investing decisions — represented a novel methodology that quickly caught fire. However, with the rise of globalization, finpubs came to the realization that an opinion-generated system can be disseminated for much cheaper with overseas contractors. Subsequently, many Americans were phased out for purely capitalistic reasons.
Now, thanks to the ascendancy of artificial intelligence, these overseas freelancers that did much of the disrupting are themselves being disrupted. After all, why pay money for mere opinions when AI can write them at a blistering pace and at a much higher level of quality? Given how relatively easy it is to program AI agents and similar automation platforms, the era of getting paid for technical analysis is rapidly coming to an end.
I’m almost certain that within five years, very few people will be paid to do technical analysis.
Instead, I believe the future is quantitative analysis. A methodology that also studies price behavior, what makes quant distinct is that it treats price action as a discretized, measurable probability space with real outcomes and distributions. Most quants borrow heavily from Kolmogorov-Markov frameworks layered with kernel density estimation (KDE).
In effect, the approach seeks to understand the “spray pattern” of a public security under different conditions. If there is a sizable difference between the projected outcomes associated with baseline conditions versus outcomes tied to the condition at hand, this delta or variance may represent an informational arbitrage.
With the latest bout of volatility in the market, traders have three enticing discounted plays to consider.
Pinterest (PINS)
A social sharing platform, Pinterest (PINS) has been reeling recently, with the company producing mixed results for the third quarter. Investors were clearly unimpressed with the soft performance, leading to PINS stock losing more than 20% in the trailing month. This past week wasn’t particularly encouraging, with the equity down over 2%. Still, with the bad news baked in, PINS could be intriguing for extreme contrarians.
Using the aforementioned Kolmogorov-Markov framework, the forward 10-week median returns of Pinterest stock can be arranged as a distributive curve, with outcomes ranging between approximately $26 and $27.60 (assuming an anchor price of $26.62, Friday’s close). Further, price clustering would likely be predominant at around $26.85.
The above assessment aggregates all sequences since April 2019, Pinterest’s IPO. However, the argument here is that PINS stock is not presently in a homeostatic or baseline state. Instead, it’s structured in a highly distributive 3-7-D formation; that is, in the trailing 10 weeks, PINS printed three up weeks, seven down weeks, with an overall downward slope.
Under this specific condition, the forward 10-week returns of PINS stock would likely range between roughly $25 and $30. Moreover, price clustering would likely be predominant at $28.
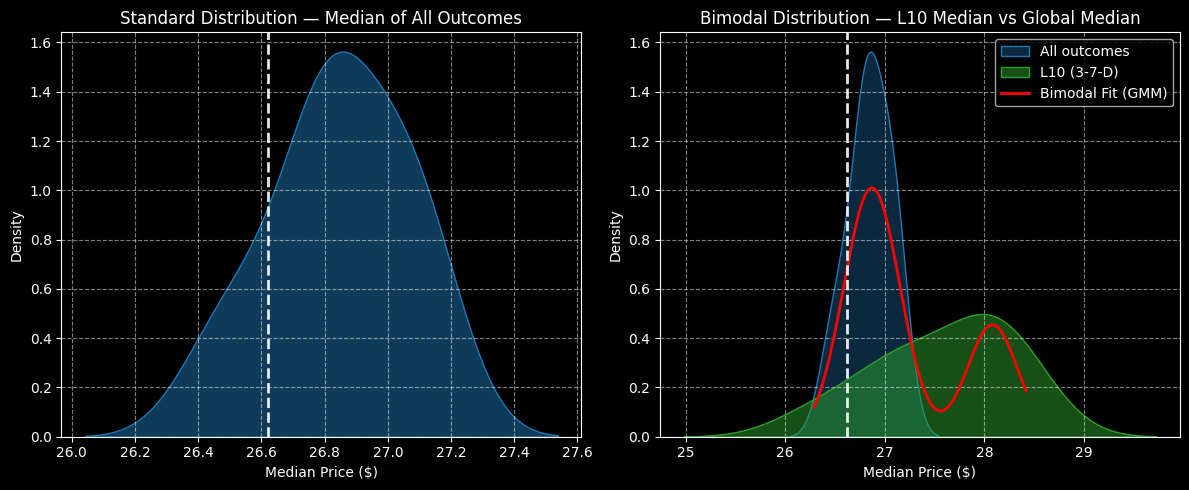
Using vertical spread data from Barchart Premier, traders can easily identify attractive trading ideas based on the clustering dynamics. One idea to consider is the 27/28 bull call spread expiring Jan. 16. If PINS stock rises through the second-leg strike ($28) at expiration — which is where prices would be expected to cluster — the maximum payout clocks in at almost 113%.
Block (XYZ)
Thanks to financial technology (fintech) specialist Block (XYZ) being exposed to the cryptocurrency sector, XYZ stock has been on quite a rollercoaster this year. Presently, the situation is ugly, with the security losing about 21%. Earlier, XYZ appeared to be consolidating upward in a steadily rising trend channel. Unfortunately, the extreme volatility in digital assets has contributed to the company’s meltdown.
Still, quant traders may view the red ink as a contrarian opportunity. Again, using the Kolmogorov-Markov methodology with KDE, the forward 10-week median returns of XYZ stock can be arranged as a distributional curve, with outcomes ranging between $59.20 and $64.10 (assuming an anchor of $60.48). Further, price clustering would likely occur at $62.20.
The above assessment aggregates data going back to January 2019. However, XYZ stock is currently not in homeostasis but is rather structured in a highly distributive 3-7-D formation: three up weeks, seven down weeks, with an overall downward slope.
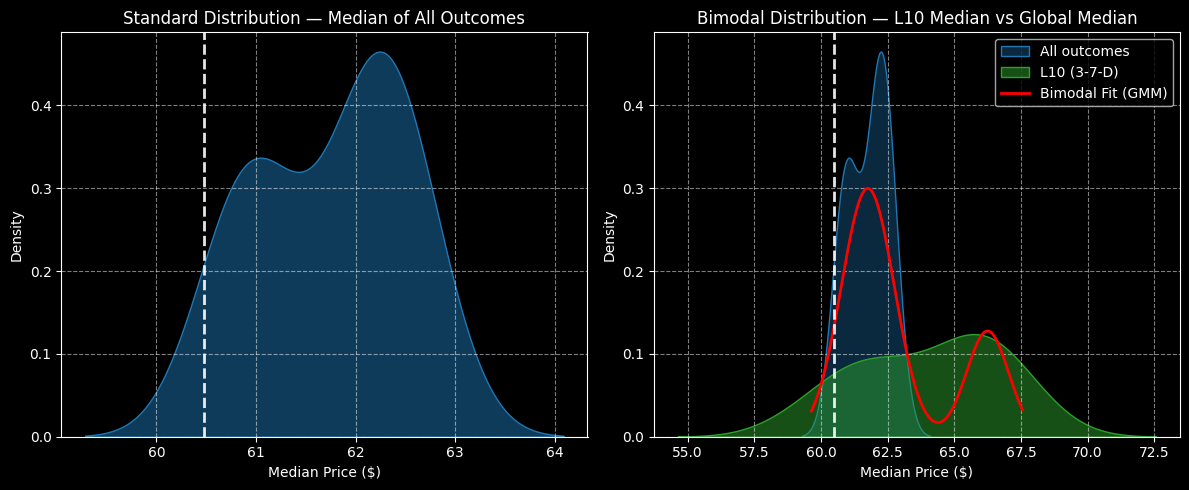
Under this setup, the forward 10-week returns should populate between $55 and $72.50, with price clustering mostly projected to occur at around $66. Given this knowledge, the trade that arguably makes the most sense is the 62.50/65.00 bull call spread expiring Jan. 16. Should XYZ stock rise through the second-leg strike at expiration, the maximum payout is nearly 136%.
HP (HPQ)
One of the riskiest ideas within the tech ecosystem, HP (HPQ) is a leading global provider of personal computing and other access devices. Ahead of its Nov. 25 earnings disclosure, circumstances don’t exactly look enticing. Since the start of the year, HPQ stock is down nearly 25%. In the past month, it slipped more than 14%. Still, despite the technical Sell recommendation, data-driven traders may want to give this another look.
Using the Kolmogorov-Markov methodology, the forward 10-week median returns of HPQ stock can be arranged as a distributive curve, with outcomes ranging between $24.50 and $25.60 (assuming an anchor price of $24.53). Further, price clustering would likely occur at $24.85.
The above assessment aggregates data going back to January 2019. But as with the other names, HPQ stock isn’t in a homeostatic state but is structured in a distributive 3-7-D sequence. Under this signal, the forward 10-week median returns would be expected to range between $24.10 and $28.85. Most notably, price clustering would likely occur at $26.90.
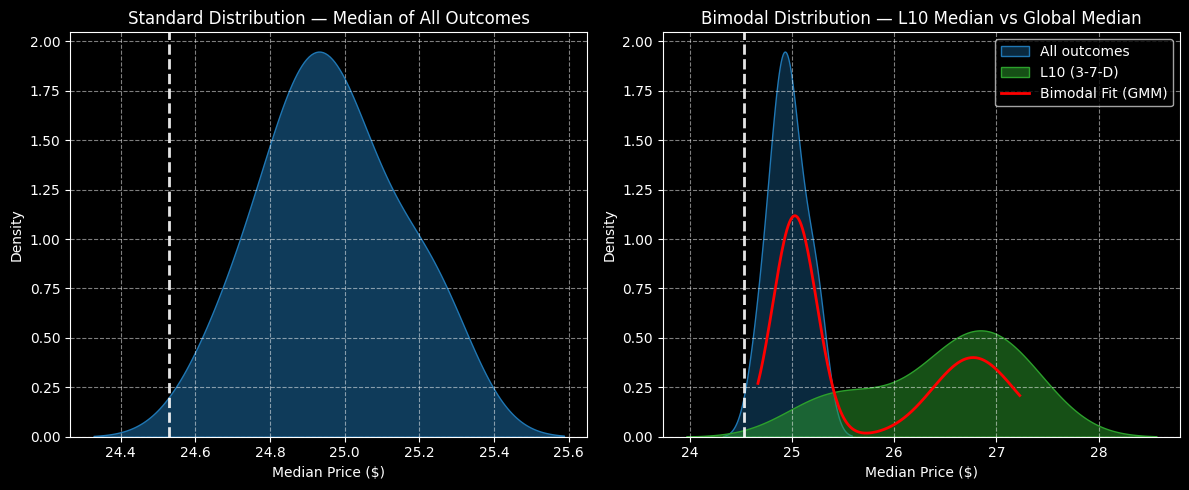
With a sizable 8.25% gap between expected and contextually realistic outcomes, HPQ stock could represent an asymmetric opportunity. Those who want to take a shot may consider the 26/27 bull spread expiring Jan. 16, which features a max payout of over 156%.
On the date of publication, Josh Enomoto did not have (either directly or indirectly) positions in any of the securities mentioned in this article. All information and data in this article is solely for informational purposes. For more information please view the Barchart Disclosure Policy here.
More news from Barchart
- The Saturday Spread: Using Quant Analysis to Uncover the Best Discounts (PINS, XYZ, HPQ)
- Michael Burry Warned That the AI Bubble Is About to Burst. If You Agree, Use Options to Bet Against These 2 Stocks.
- These 3 Unusually Active Puts Deep ITM Offer Strategic Plays for Both Bulls and Bears
- Cisco Delivered Strong, But Lower Free Cash Flow and FCF Margins - Has CSCO Stock Peaked?