Here's the simple answer to the “how high can the Fed go?” question: a lot higher. Not only does inflation still rage on, but the Federal Open Market Committee (FOMC) is still well below its projected peak rate of 5%. Based on the trends and the FOMC's past decisions, it is likely the dip in the pace of the Consumer Price Index is just a blip on the radar and it has happened before.
The pace of consumer inflation dipped from February 2022 to summer 2022 and then reaccelerated to near-record levels, which could easily happen again. The underlying causes of inflation are still in place and likely won't come down significantly until sometime in 2023. Among those are high oil prices, rising wages and tight labor markets, none of which appear ready to correct.
Goldman Sachs Ups its Target for Base Rates
A day after Fed hawk James Bullard came out and said Federal Reserve interest rate hikes have had only “limited effects” on inflation, Goldman Sachs upped the ante, predicting the peak rate would top out above the current 5% target rate. According to them, the Fed will need to enact another 25-basis point hike in May in order to achieve a sustained slowdown in the economy. The risk is that mortgage rates, a pillar of the U.S. economic system, could top out close to 10% and have a resounding impact on broad economic activity.
As it is, the National Association of Home Builders Housing Market Index is down for the 11th consecutive month and trending lower. The latest reading has the housing market at its lowest level since June 2012. All three components continue to move lower as well. The leading component, traffic of potential buyers, fell to only 20 from the previous month's 25.
As the housing market activity trends lower, the leading indicator within the index moves lower and the peak of interest moves higher, this situation will only worsen. This means home builder stocks (NYSEARCA: XHB) and related industries will have a tough time in 2023, while discretionary stocks such as DIY retailers like Lowe’s (NYSE: LOW) and component/appliance manufacturers like Whirlpool (NYSE: WHR) get a potential tailwind from remodelers and upgraders who chose to remain in place.
Who Benefits from Higher Rates?
The only sector to really benefit from higher interest rates is the financial sector (NYSEARCA: XLF) because higher interest rates can mean widening margins and improved earnings. While the S&P 500 financial sector is the dog of the index in 2022, it should become one of its stars in 2023. The consumer discretionary sector outperformed it in terms of earnings growth. The consensus estimate for 2023 EPS growth for the sector topped 14% in early November 2022 and was on the rise, supported by inflation and the outlook for higher interest rates.
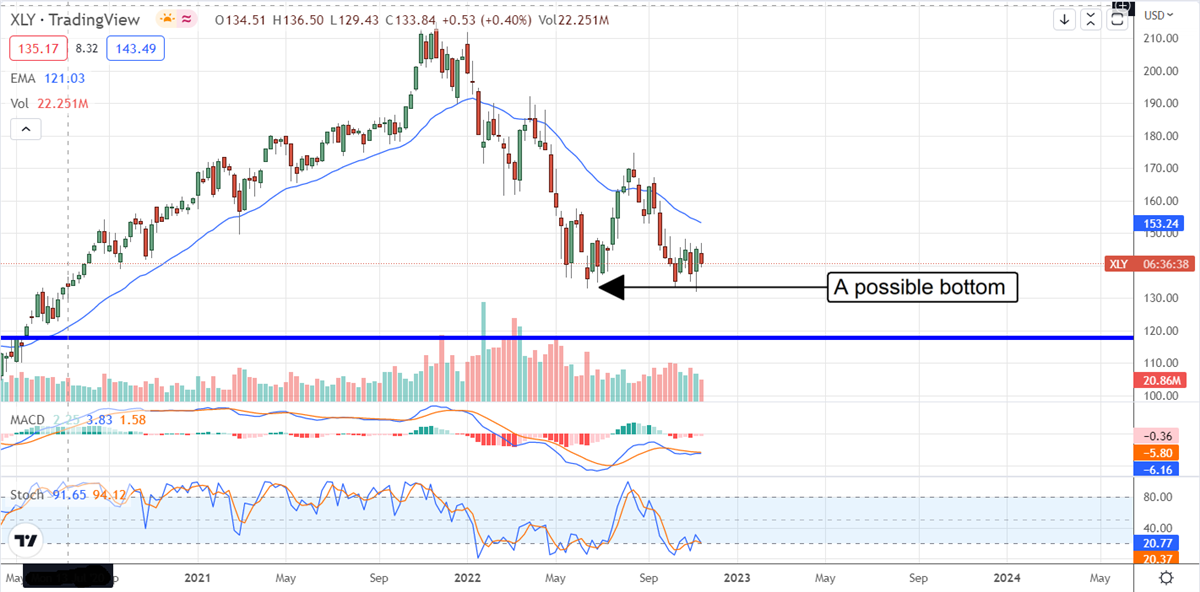
The Technical Outlook: Consumer Discretionary to Lead in 2023?
The consumer discretionary sector has pulled back from it peak to trade in line with the broad S&P 500 (NYSEARCA: SPY). This has the sector set up to rebound assuming consumers can focus earnings on discretionary items in 2023. If so, the recent action in the sector could turn out to the bottom or near the bottom, but it is too soon to tell. The Consumer Discretionary Sector ETF (NYSEARCA: XLY) has shown signs of a bottom at the $125 level but it is not confirmed.
A move up from the current level would indicate a possible double-bottom while a slower turnaround could trace out a head and shoulders pattern at this stage in the game. The indicators are consistent with a bottom as well, so there is more than hope riding on this outlook. A move upward would be bullish but may find resistance at the $160 to $170 level while a move lower would be bearish and bring the stock closer to the support target of $120.