The PCE price index cooled on a month-to-month and YOY basis, precisely what the market wanted to see. The bad news is that the index cooled less than expected at the core level YOY and remains hot at 4.7%. At this level, inflation has peaked but is still trending in a range that is more than double the Fed's target and has them on track to continue hiking rates well into 2023. The added risk is that those upward revisions to previous data are also still in the picture, so there is a chance we'll see this month's figure pushed up in the coming months.
What this means for the FOMC is that they still have work to do. They are likely to keep the pace of interest rate hikes slower than the historic 75 bps pace it set earlier in the year, but the peak of interest rates is still on track to top 5.0%. So the odds of a single hike at the February 1 meeting are sitting at 100% right now, and there is a 33% chance for another 50 bipper if the following few data points don't show further improvements.
Recession Is At Hand, Leading Indicators Accelerate Their Decline
The general outlook for recession is that a recession is coming in 2023; the question is how deep it will be. Based on the Index of Leading Indicators, the potential for the decline is getting bigger each month. For example, the latest read for November has the LDI sitting at -1.0% and down from the previous months' -0.9%.
This is not only the lowest reading since the pandemic low but the 4th month of acceleration and the 8th month of a negative reading. Assuming the FOMC is to blame for these figures (they are), it is highly likely we'll see this figure continue to decline in the coming months, and it is seeing downward revisions to previous data as well.
Among the most notable leading indicators are the number of man-hours worked in manufacturing which is the most significant component and worth more than 25% of the index reading. Based on the ISM hiring data, the Philly Fed's MBOS and the Empire State Manufacturing Survey are in decline and fall.
Other leading indicators, including the average prime rate and building permits, are also negatively impacting the index and are expected to worsen. On the housing front, the NAHB Home Builders Sentiment Index hit a new low not seen since the housing crisis, and it is being led lower by rising rates and dwindling traffic of prospective buyers.
Assuming the FOMC hits the market's target for peak interest rates of 5.0%, the average 30-year mortgage rate will run hotter than 8.0% in 2023, which is a total of 100 basis points more desirable than it is now. Assuming the FOMC has to keep rates at elevated levels into 2024 as it keeps hinting that those rates will have a long-term impact on housing.
The takeaway from the homebuilder's guidance for next year is that business could fall 30% or more. That will impact manufacturing hours and home-building activity and keep the leading indicators in negative territory. This means recession could be extended, drawn out, and potentially deep at its bottom.
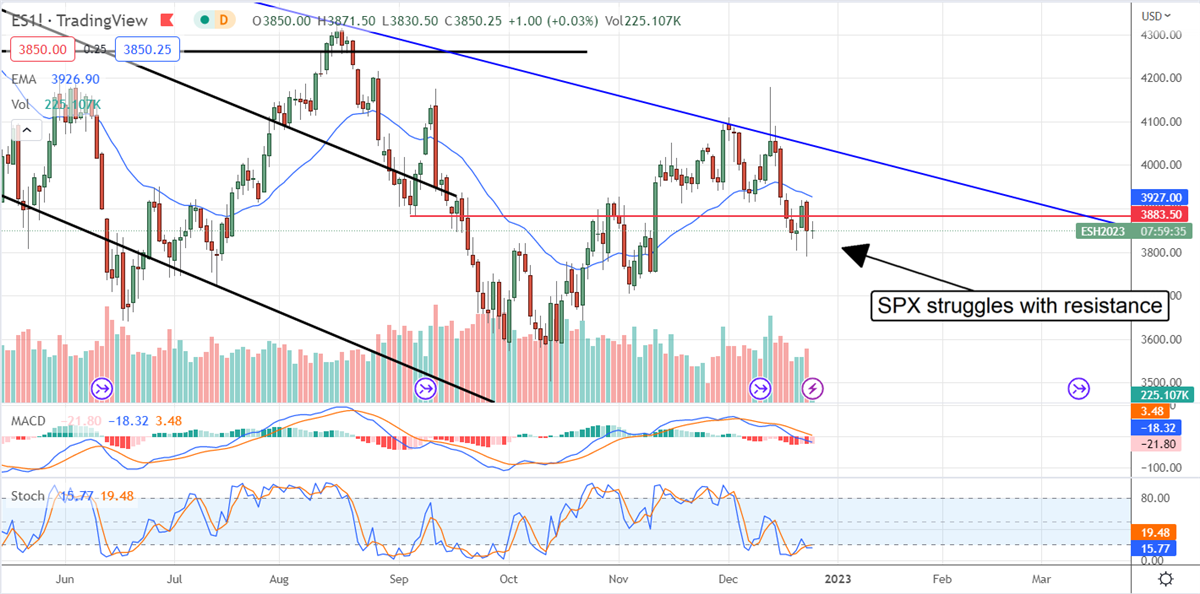
The Technical Outlook: The S&P 500 Is On Shaky Footing
The S&P 500 (NYSE: SPY) may rally over the holiday week but don't read too much into that. The latest signals have the index mired in a downtrend that could take it back to the 3,500 level or lower. At best, the index will continue to move sideways within the range that is being established, but it depends on the earnings outlook. If the earnings outlook continues to weaken, the S&P 500 will move down to set a new low.