- History shows that a recession is a needed pullback to make the markets pliable for new highs
- The last three recessions occurred in the new millennium
- Historically, recessions last an average of 17 months
History of Three Recent Recessions
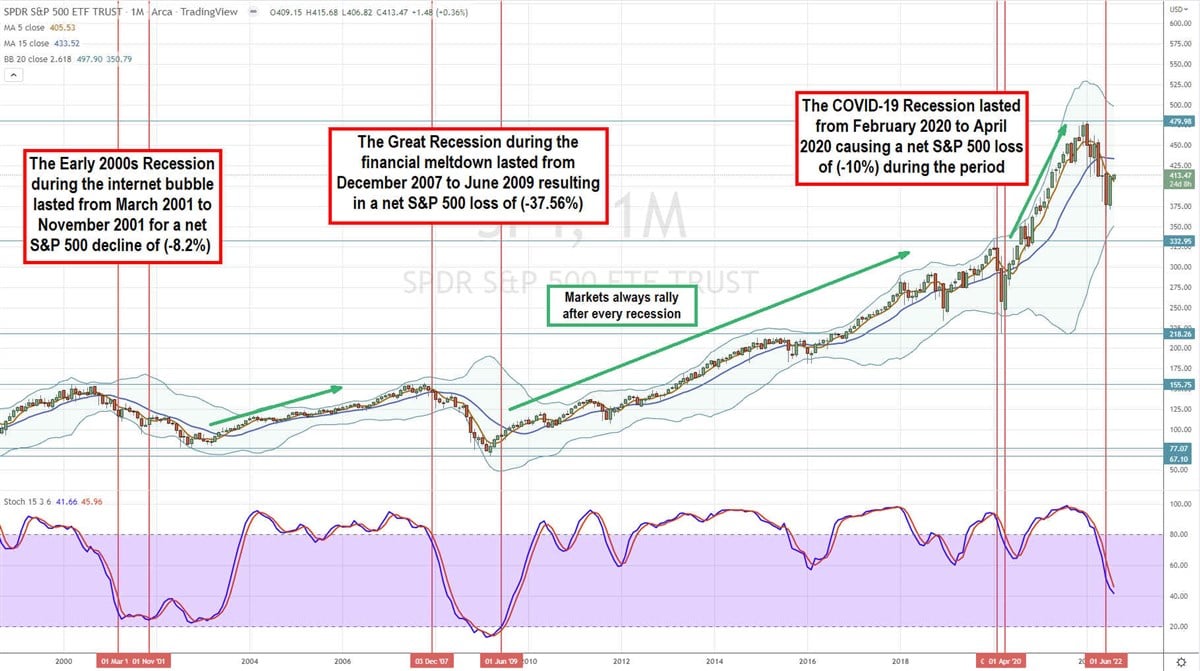
The last three recessions occurred in the new millennium. The Early 2000s recession occurred during the internet bubble and subsequent bear market as the S&P 500 (NYSEARCA: SPY) fell (-26.3%) from its highest point at $155.75 to round out the loss at (-8.2%) by the end of November 2021. The SPY continued to sell-off for the next 11 months until making its lows of $77.07 by October 2002. The SPY managed to rally back towards the $155.75 previous highs during the real estate bubble by June 2007. Unfortunately, the SPY plunged into the next recession in December 2007. The Great Recession saw the financial meltdown trigger a sell-off of (-55.47%) to $67.10 from the SPY highest point of $155.75 to close out (-37.56%) during the 16 month period ending June 2009. Markets managed to recover as the SPY broke through the prior high and double top of $155.75 in March of 2013 and continue to hit all-time highs of $332.95 by January 2020 at the dawn of the COVID-19 pandemic triggering the most recent recession. The COVID-19 recession lasted two months as the SPY fell (-33.9%) to a low of $218.26 before bouncing to close out a (-10%) decline by April 2020. The markets would stage a slingshot rally that broke back up through the highs of $332.95 by August of 2020 and continue to surge to new all-time highs of $479.98 by January 2022 before falling again into the current recession of 2022. The SPY has hit a high of $479.98 in January 2022 and fell (-24.5%) to a low of $362.17 by June 2022 before staging a rally in August. For the last three recessions the SPY has fallen (-26.3%), (-55.47%), and (-33.9%) from its highs to lows. This current recession has seen a (-24.5%) drop from high to lows assuming the lows are held.
Using Rifle Charts to Spot the End of the Recession
Using the rifle charts on a monthly basis, we can see that each recession recovery was preceded by the stochastic cross back up, a rising 5-period moving average (MA) support and a monthly market structure low (MSL) buy trigger. The 2001 recovery started on a 25-band cross up. The 2009 recovery started on a 20 band cross up. The 2020 recovery started on a 70-band cross up. While a low band cross up through or off the 20-band is preferred, the COVID-19 recovery triggers on the 70-band cross up. All three reversals occurred after the monthly stochastic has crossed back up. Currently the monthly stochastic is still falling at the 40-band but has gotten back above the monthly 5-period MA at $405.53. The monthly MSL trigger will be determined by the SPY’s highest price in August 2022. If the SPY can break through August’s highs while the 5-period MA support rises or crosses over the 15-period MA and the stochastic crosses back up, then we are out of the proverbial woods. This will take at least two months or two monthly candles to confirm, assuming the SPY doesn’t break the swing low of $362.17. The market usually recovers before the end of the recession. However, it is certainly possible for markets to continue lower even after the recession as illustrated by the Early 2000s recession. The caveat was the unprecedented 911 World Trade Center terrorist attack causing markets to sell-off lower until the U.S. launched its war in Afghanistan in 2002. The most recent two recessions saw the stock market bottom first and didn’t look back afterwards.