Commercial Metals (NYSE: CMC) stock price corrected over the past year due to falling prices and concerns over demand. The company’s Q3 results belie that sentiment and have the market moving higher. The results prove the company’s resiliency in the face of tough times and solid underlying demand in most segments. The real takeaway is that prices for metals have fallen, but costs are also coming back into line.
Costs are up compared to last year but down significantly compared to last quarter, resulting in a solid bottom-line beat. The takeaway is that Commercial Metals Company is on solid footing; it generates healthy cash flow and drives shareholder value.
Commercial Metals Company does not pay a large dividend or repurchases shares in large amounts, but the combined returns work out to more than 2.25% annually. The attraction is in the safety of the returns and the outlook for sustainability and distribution growth. The company is paying out less than 10% of its earnings, and leverage is low, so there is a high expectation the company will extend the 2-year history of annual increases to 3,4,5 and more.
Share repurchases totaled $16.5 million in the quarter, which annualizes to 1.0% in addition to the 1.25% dividend yield. The repurchases are not enough to offset share-based compensation issued during the quarter, but balance sheet improvement mitigates the impact.
The company repaid $214 million in long-term debt, substantially impacting the balance sheet. The company’s cash position is down YOY but still robust at $475 million, while assets are up and debt and liabilities are down. The cash position should improve over the next few quarters as start-up costs for new operations fall out of the equation.
The company reported $5.8 million in after-tax charges in Q3, which shaved $0.04 off the bottom line.
Commercial Metals Company Has Sold Quarter
Commercial Metals Company had a solid quarter despite significant declines in pricing across 2 of 3 operating segments. The company brought in $2.34 billion in net revenue for a decline of 7.1% YOY that beat the consensus by 450 basis points. The strength was driven by activity in NA offset by weakness in Europe.
North American activity is supported by construction related to reshoring supply chains and government spending. On a volume basis, volume is up in most segments and strong in all.
The margin news is also good. The company reports costs are up compared to last year but falling sequentially and are expected to hold steady in the current quarter. This led to a 29% increase in core EBITDA and adjusted earnings 1100 basis points above consensus. The $2.02 beat by $0.20 and is leading the market higher.
The company didn’t give formal guidance, but the outlook includes a double-digit increase in North American New Bid activity and a downstream backlog trending near record highs that suggests sequential growth in revenue and earnings.
The Sell-Side Supports Commercial Metals Company
The sell-side activity is a little iffy but ultimately supportive of the price action. The analysts rate the stock a Hold, down from Moderate Buy last year, despite a recent upgrade to Buy. The price target assumes 9% of the upside and is trending higher, but the most recent revision was in Q1. Regarding the institutions, they own about 83% of the stock and are buying on balance, but their activity is nearly even and suggests rotation within the group.
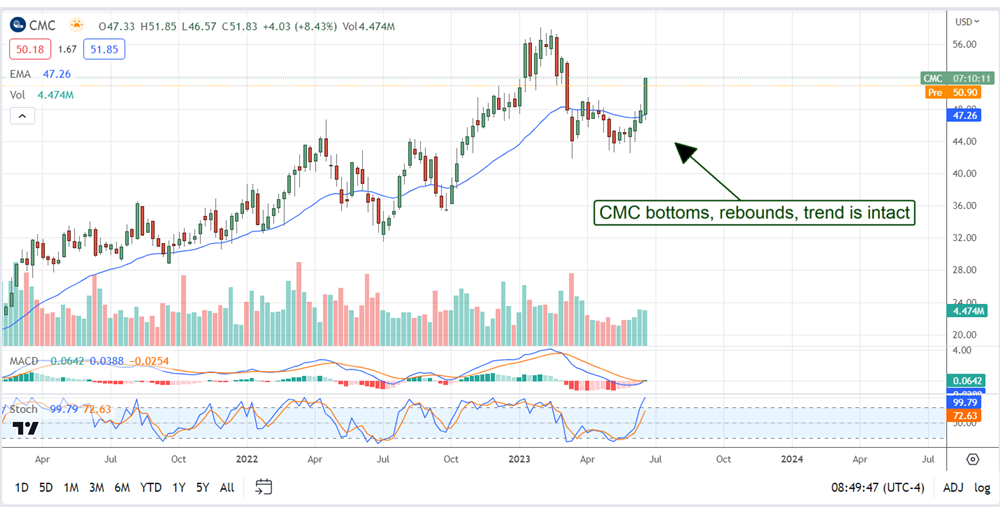
The chart is promising and shows a bottom at the $44 level. The market surged on the Q3 results and may continue higher. The move confirms the uptrend put in place in 2020 and could lead the stock back to an all-time high. That move would be worth at least 14%.