The iShares Russell 2000 ETF (NYSE: IWM) has displayed relative weakness and lagged the overall market over the previous year. However, it notably broke that trend last week and finally showed signs of life. The IWM is a float-adjusted, capitalization-weighted index that measures the performance of the U.S. equity market's small-capitalization (small-caps) sector. Last week, the IWM impressively outperformed the leading industry in the market, technology - Invesco QQQ (NASDAQ: QQQ) and the S&P500 – SPDR S&P 500 ETF (NYSE: SPY).
It's no surprise that the IWM underperformed over the previous year. During periods of downturn and uncertainty in the markets, small-cap, speculative stocks have consistently underperformed and experienced risk-off outflows.
IWM vs. SPY
YTD, the IWM is up 4.39%, mainly thanks to its performance last week, closing the week up 4.51%. While that might sound impressive given the overall market's performance, it still lacks in comparison to the SPY ETF, which is up 11.89% YTD.
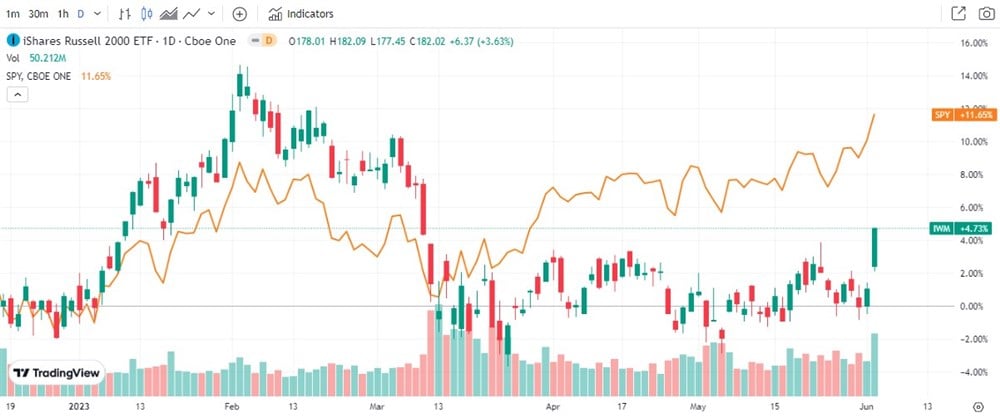
The relative weakness is seen in the above chart, comparing the performance of IWM to SPY. If you'd like to conduct a similar study, click the plus symbol on the MarketBeat chart.
After bottoming out in March, the IWM traded sideways between $170 and $180. During that period, SPY, primarily driven by the strength in technology and a handful of market-leading names, has been trending higher and closed the week at YTD highs.
The uptrend and notable strength in the overall markets have resulted in a long-awaited breakout in small-caps and the IWM, as speculative capital looks to be flowing back into a sector traditionally holding more considerable risk.
For example, U Power (NASDAQ: UCAR), a company with a $472.28 million market capitalization, thereby making it a small-cap stock, experienced a significant surge in volume and value after the company announced a strategic cooperation agreement last week. Shares of the company closed the week up 157.43% and traded close to 200m in volume in the two days following the announcement. Such follow-through for a small-cap, in both volume and price action, points towards increased optimism and speculation for small-cap stocks.
UCAR was not an isolated event, with several other small-cap stocks experiencing an uptick in volume and price. The breakout in IWM and relative strength displayed versus other indexes and medium to large-cap stocks is a clear shift in sentiment and one to pay close attention to.
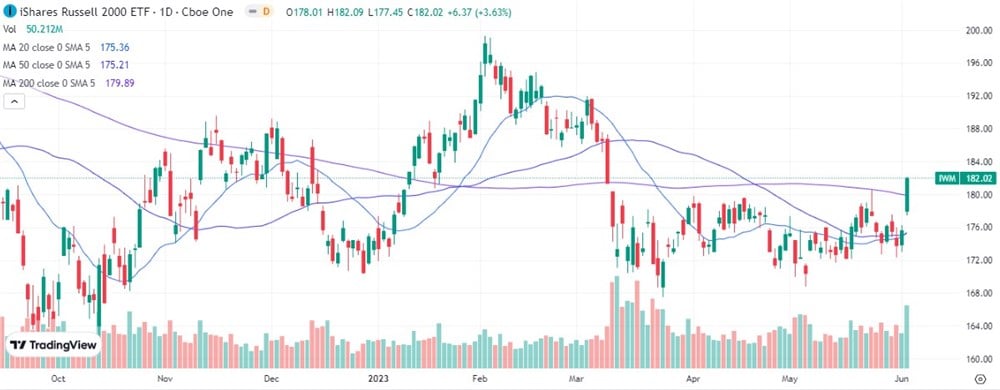
The Long-Awaited Breakout in IWM
Since the beginning of 2023, the IWM has spent most of its time lagging behind the overall market and trading near crucial support in the low $170s. While a handful of market-leading names have soared higher, like Apple (NASDAQ: AAPL), Microsoft (NASDAQ: MSFT), NVIDIA (NASDAQ: NVDA), and Tesla (NASDAQ: TSLA), helping the overall market and specific respective sectors outperform, it's primarily been risk-off for the IWM and small-cap stocks.
However, the breakout over resistance on Friday, with a surge in volume, represents a shift in sentiment and momentum. The IWM traded over 49m shares on Friday, considerably higher than its 32.76 million average daily volume. The range expanded on the day, with the stock experiencing a daily range of 4.64 versus its ATR of 3.33. The increased range and volume signal a shift in sentiment and provide validity to the breakout and newfound risk-on environment.
Should You Invest in the IWM?
The tide might be quickly shifting for the small-cap stocks and the IWM. Friday's breakout confirmed that, with the IWM trading above all short-term key SMA's on increased volume and strength. Notably, several individual small-caps, like UCAR, experienced follow-through to the upside after releasing breaking news.
With the breakout still fresh in the IWM, the risk: reward at current levels remains attractive for investors who might have been stalking the ETF for entry and exposure to small-cap stocks. If the IWM can continue to display relative strength and find price stability over the previous resistance of $180, the ETF might be heading towards $185 - $190 in the short term.