
Understanding the dynamics of a pullback is crucial for investors seeking to capitalize on short-term market fluctuations. A pullback is a temporary price decline in a stock or index that contradicts the prevailing trend. Often viewed as buying opportunities, pullbacks allow investors to enter a potentially profitable position at a lower cost basis. However, misinterpreting a pullback as a buying opportunity when the market is actually signaling a reversal can lead to significant losses. So, how do you tell the difference between a pullback and a reversal?
Defining Pullback Characteristics
A pullback represents a brief interruption in an established trend, characterized by a temporary reversal in price movement. These retracements are typically short-lived, lasting for a few trading sessions before the original trend reasserts itself. Understanding that pullbacks are a natural part of market cycles is essential for investors to avoid panic selling during these temporary dips.
Recognizing Potential Trend Reversals
While pullbacks offer potential buying opportunities, it's crucial to differentiate them from more permanent trend reversals. Several key indicators can help investors make this distinction.
Volume as a Leading Indicator
Trading volume provides a crucial indicator of market sentiment and can help investors distinguish between temporary pullbacks and potential trend reversals. The key to analyzing trading volume is understanding the relationship between price movement and trading activity.
A significant increase in volume accompanying a pullback suggests that a larger downturn might be underway. This surge in trading activity indicates that a substantial number of investors are selling their positions, driving the price lower. A high-volume pullback indicates strong sell-side pressure that could potentially overpower the prevailing upward trend, signaling a potential trend reversal.
In contrast, low-volume pullbacks often indicate a temporary correction within an ongoing uptrend. Lower trading volume during a pullback suggests that the price decline is primarily driven by profit-taking from short-term investors or weak longs rather than a broad shift in market sentiment. These pullbacks, characterized by limited selling pressure, often represent a healthy pause before the primary trend resumes.
Investors should use trading volume alongside other technical indicators as a valuable confirmation tool. While a high-volume pullback suggests a potential trend reversal, a low-volume pullback often signals a temporary correction. By analyzing trading volume in conjunction with other technical indicators and fundamental analysis, investors can make more informed decisions regarding their trading strategies and risk management.
Technical Indicators as Confirmation Tools
Technical indicators provide further evidence for confirming potential reversals. The Relative Strength Index (RSI), a momentum oscillator, measures the magnitude of recent price changes to evaluate overbought or oversold conditions. An RSI reading above 70 often indicates an overbought market, while a reading below 30 suggests an oversold market. During a pullback, if the RSI fails to bounce back from oversold levels or breaks down from overbought levels, it can signal a potential reversal.
Similarly, the Moving Average Convergence Divergence (MACD), another popular indicator, tracks the relationship between two moving averages. A bearish crossover, where the MACD line crosses below the signal line, can indicate weakening momentum and a potential reversal, particularly if it occurs during a pullback.
Chart Patterns: Signals in Price Action
Chart patterns offer visual representations of price movements, revealing potential trend changes. The Head and Shoulders pattern, a bearish reversal pattern, is characterized by three peaks, with the middle peak (the head) being the highest and the two outer peaks (the shoulders) being roughly equal in height. A pullback that breaks below the neckline, a support line connecting the two shoulders, can signal a potential reversal.
Breakouts, where prices move decisively beyond established support or resistance levels, can also indicate a trend reversal. A pullback that breaks through a significant support level with high volume confirms the weakening sentiment and suggests a potential change in the prevailing trend.
Implementing Effective Risk Management
Regardless of an investor's experience, effective risk management is crucial when trading pullbacks. Stop-loss orders are essential tools that automatically sell a security when it reaches a pre-determined price, limiting potential losses. Traders should place stop-loss orders below key support levels during pullbacks, mitigating downside risk in case the market reverses.
The risk-reward ratio, a measure comparing the potential profit of a trade to its potential loss, helps investors make calculated decisions. A favorable risk-reward ratio, where the potential reward outweighs the potential risk, is crucial for any trading strategy, especially when capitalizing on pullbacks.
Real-World Examples
The pullback strategy can work on all stocks and electronically traded funds (ETF), regardless of their sector, from manufacturing to technology. Examining real-world instances helps illustrate how these indicators can signal a shift from a pullback to a reversal. To demonstrate the concept of pullbacks and their potential to transition into reversals, let's examine the recent performance of the SPDR S&P 500 ETF Trust (NYSEARCA: SPY).
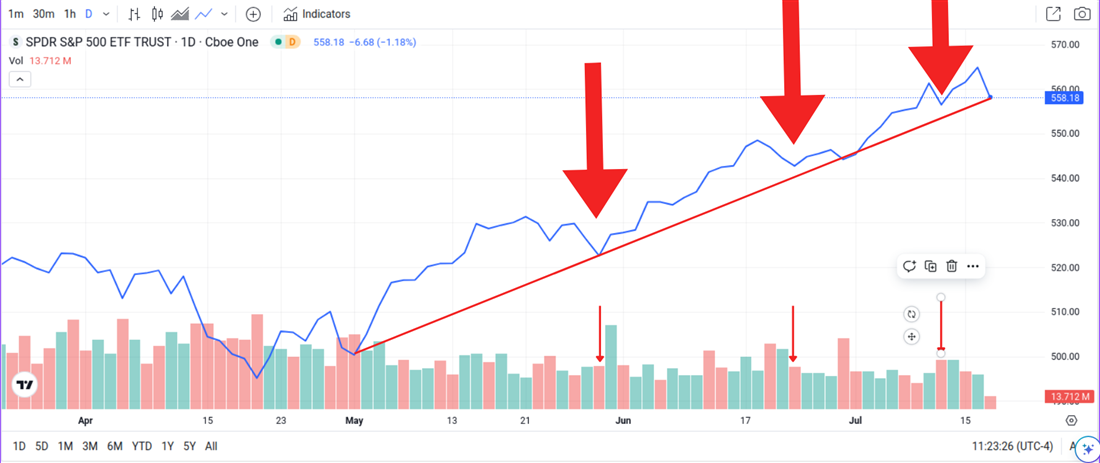
The SPY, a popular exchange-traded fund tracking the S&P 500 index, exhibited an upward trend, rising from $500 to $558 over several weeks. Several low-volume pullbacks occurred during this period, suggesting temporary corrections within a continuing uptrend.
SPY experienced a pullback to $522 in late May, followed by a subsequent rise to $548. This pattern reflects a characteristic of low-volume pullbacks, where the decline is often short-lived, and the underlying upward trend resumes.
On June 24th, SPY experienced another low-volume pullback, declining to $542. However, the ETF resumed its upward trajectory, reaching $561 by July 10th. This pattern again suggests a temporary correction within a continuing uptrend.
On July 11th, SPY experienced another low-volume pullback to $556. The ETF has since risen to $564 on July 16th, further suggesting that these pullbacks have been temporary corrections within a broader upward trend.
This real-world example illustrates the importance of analyzing trading volume and other technical indicators when evaluating pullbacks. While the low-volume pullbacks in the SPY have been characterized by short-lived price declines followed by a resumption of the upward trend, a high-volume pullback accompanied by a bearish RSI and a bearish MACD crossover could signal a potential reversal, making it less favorable for investors to enter a new position.
While pullbacks offer enticing opportunities to buy stocks at lower prices, knowing when a pullback is no longer a buying opportunity is crucial for successful investing. Investors can improve their decision-making and navigate market fluctuations more confidently by analyzing volume, monitoring technical indicators, recognizing chart patterns, and implementing proper risk management techniques. Remember, the key lies in distinguishing temporary corrections from more permanent trend reversals.