
Regional banking company Simmons First National (NASDAQ: SFNC) missed Wall Street’s revenue expectations in Q3 CY2025, with sales falling 426% year on year to -$569.5 million. Its non-GAAP profit of $0.46 per share was in line with analysts’ consensus estimates.
Is now the time to buy Simmons First National? Find out by accessing our full research report, it’s free for active Edge members.
Simmons First National (SFNC) Q3 CY2025 Highlights:
- Net Interest Income: $186.7 million vs analyst estimates of $187.7 million (18.4% year-on-year growth, 0.6% miss)
- Net Interest Margin: 3.5% vs analyst estimates of 3.5% (3.8 basis point beat)
- Revenue: -$569.5 million vs analyst estimates of -$150.5 million (426% year-on-year decline, 278% miss) due to $801.5 million pre-tax loss on the sale of low-yielding securities that were sold in connection with the previously mentioned balance sheet repositioning included in noninterest income
- Efficiency Ratio: -25.1% vs analyst estimates of 58.9% (8,397.8 basis point beat)
- Adjusted EPS: $0.46 vs analyst estimates of $0.47 (in line)
- Tangible Book Value per Share: $13.45 vs analyst estimates of $13.68 (19.9% year-on-year decline, 1.7% miss)
- Market Capitalization: $2.75 billion
Company Overview
With roots dating back to 1903 and a presence across Arkansas, Kansas, Missouri, Oklahoma, Tennessee, and Texas, Simmons First National (NASDAQ: SFNC) is a regional bank holding company that provides banking and financial services to individuals and businesses.
Sales Growth
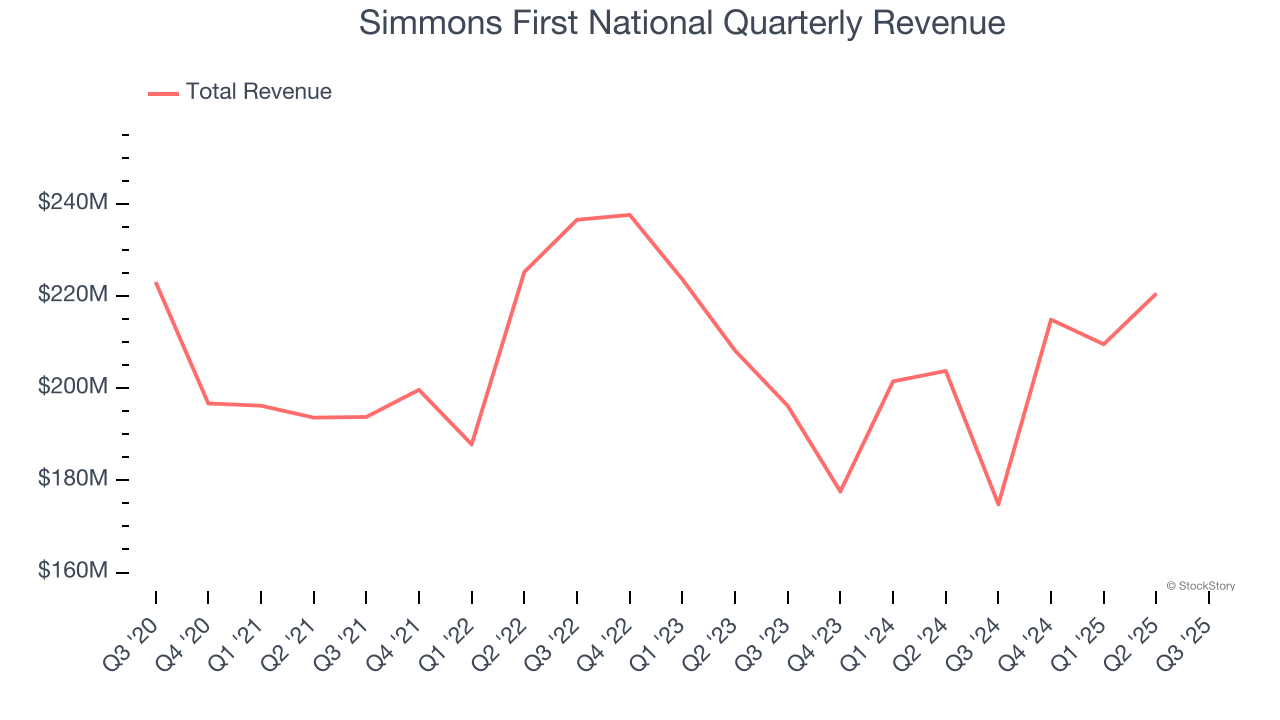
In general, banks make money from two primary sources. The first is net interest income, which is interest earned on loans, mortgages, and investments in securities minus interest paid out on deposits. The second source is non-interest income, which can come from bank account, credit card, wealth management, investing banking, and trading fees. Unfortunately, Simmons First National struggled to consistently increase demand as its $75.58 million of revenue for the trailing 12 months was close to its revenue five years ago. This was below our standards and is a sign of poor business quality.
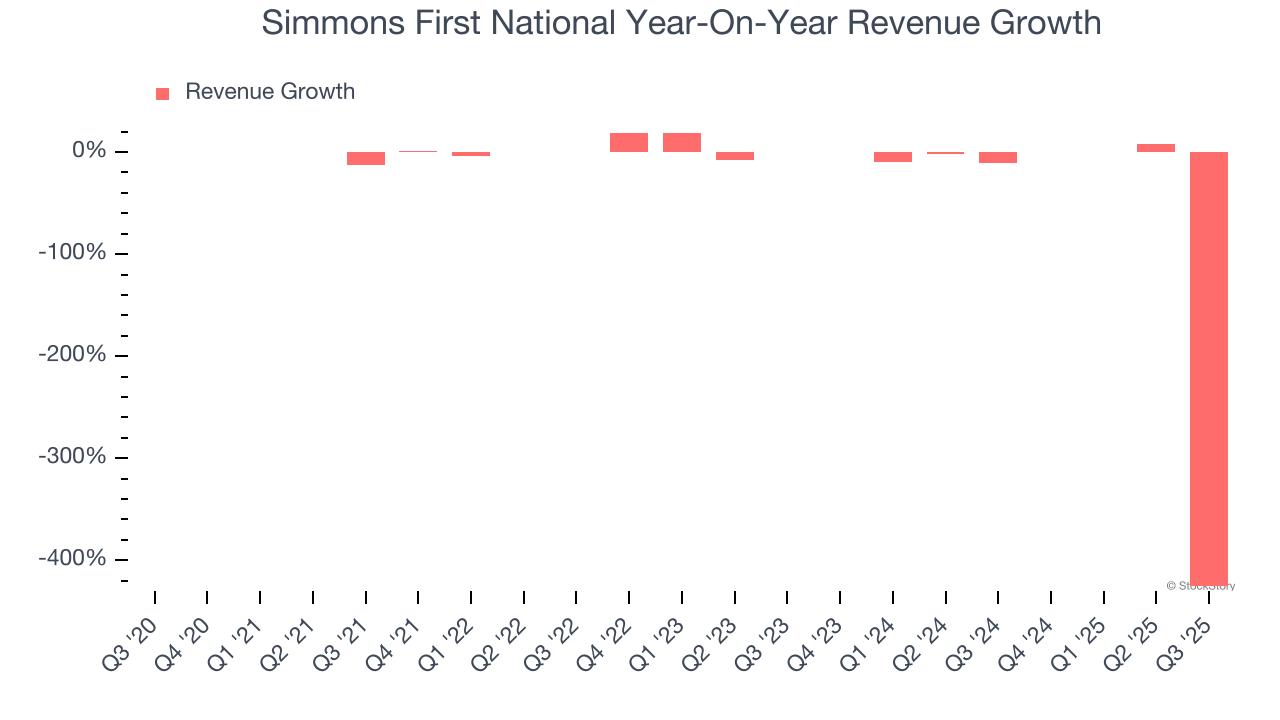
Note: Quarters not shown were determined to be outliers, impacted by outsized investment gains/losses that are not indicative of the recurring fundamentals of the business.We at StockStory place the most emphasis on long-term growth, but within financials, a half-decade historical view may miss recent interest rate changes, market returns, and industry trends. Simmons First National’s annualized revenue declines of 1.8% over the last two years align with its five-year trend, suggesting its demand has consistently shrunk.
Note: Quarters not shown were determined to be outliers, impacted by outsized investment gains/losses that are not indicative of the recurring fundamentals of the business.
This quarter, Simmons First National missed Wall Street’s estimates and reported a rather uninspiring 426% year-on-year revenue decline, generating -$569.5 million of revenue. This was due to a $801.5 million pre-tax loss on the sale of low-yielding securities that were sold in connection with the previously mentioned balance sheet repositioning included in noninterest income
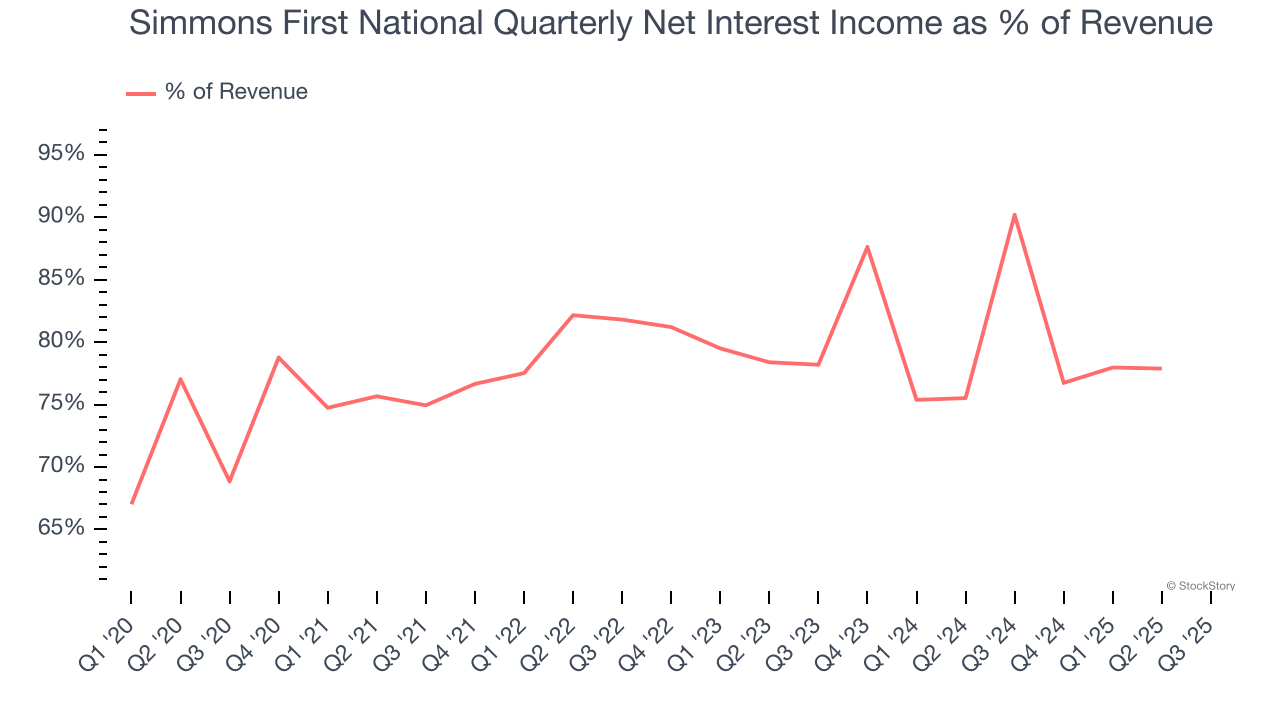
Net interest income made up 73.4% of the company’s total revenue during the last five years, meaning lending operations are Simmons First National’s largest source of revenue.
Note: Quarters not shown were determined to be outliers, impacted by outsized investment gains/losses that are not indicative of the recurring fundamentals of the business.
Net interest income commands greater market attention due to its reliability and consistency, whereas non-interest income is often seen as lower-quality revenue that lacks the same dependable characteristics.
Here at StockStory, we certainly understand the potential of thematic investing. Diverse winners from Microsoft (MSFT) to Alphabet (GOOG), Coca-Cola (KO) to Monster Beverage (MNST) could all have been identified as promising growth stories with a megatrend driving the growth. So, in that spirit, we’ve identified a relatively under-the-radar profitable growth stock benefiting from the rise of AI, available to you FREE via this link.
Tangible Book Value Per Share (TBVPS)
Banks are balance sheet-driven businesses because they generate earnings primarily through borrowing and lending. They’re also valued based on their balance sheet strength and ability to compound book value (another name for shareholders’ equity) over time.
This explains why tangible book value per share (TBVPS) stands as the premier banking metric. TBVPS strips away questionable intangible assets, revealing concrete per-share net worth that investors can trust. On the other hand, EPS is often distorted by mergers and flexible loan loss accounting. TBVPS provides clearer performance insights.
Simmons First National’s TBVPS declined at a 3.5% annual clip over the last five years. A turnaround doesn’t seem to be in sight as its TBVPS also dropped by 4.6% annually over the last two years ($14.77 to $13.45 per share).
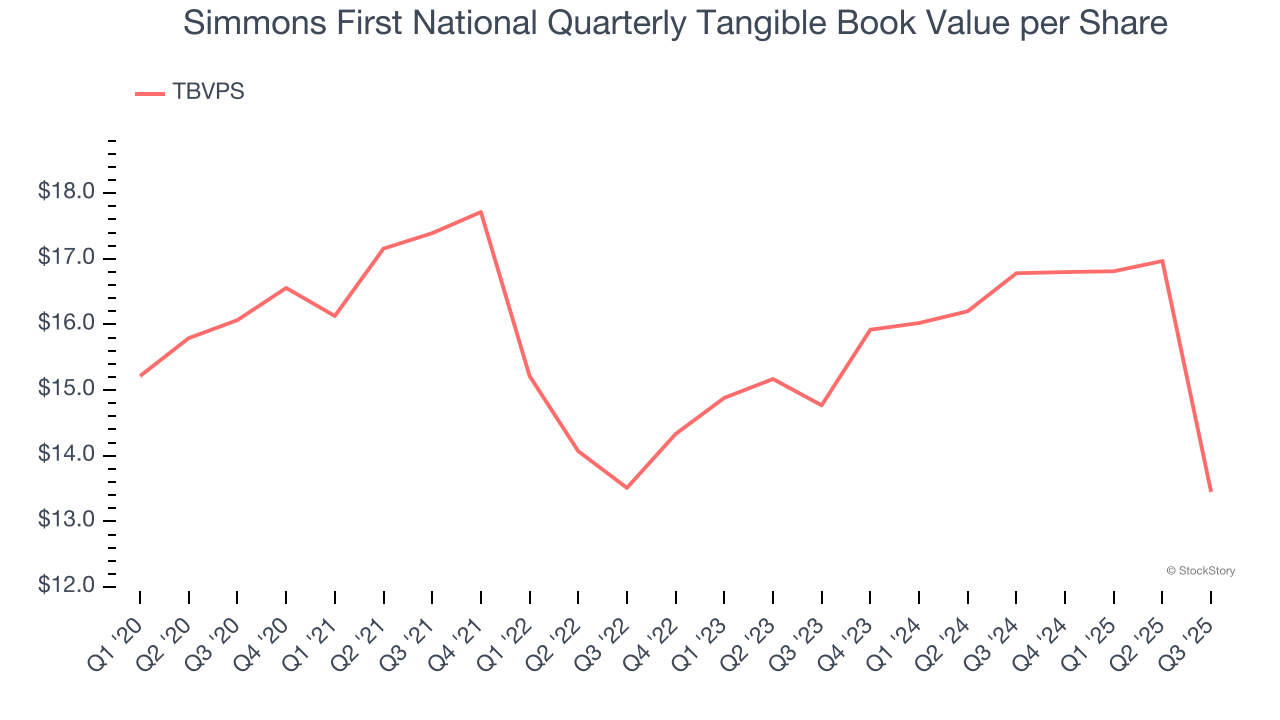
Over the next 12 months, Consensus estimates call for Simmons First National’s TBVPS to grow by 11.5% to $14.99, solid growth rate.
Key Takeaways from Simmons First National’s Q3 Results
We struggled to find many positives in these results. Its revenue missed and its EPS was in line with Wall Street’s estimates. Overall, this was a softer quarter. The stock traded down 1.3% to $17.80 immediately following the results.
Simmons First National may have had a tough quarter, but does that actually create an opportunity to invest right now? When making that decision, it’s important to consider its valuation, business qualities, as well as what has happened in the latest quarter. We cover that in our actionable full research report which you can read here, it’s free for active Edge members.