Aerospace and defense technology solutions provider Astronics Corporation (NASDAQ: ATRO) announced better-than-expected revenue in Q1 CY2025, with sales up 11.3% year on year to $205.9 million. The company’s full-year revenue guidance of $840 million at the midpoint came in 0.9% above analysts’ estimates. Its non-GAAP profit of $0.44 per share was 46.7% above analysts’ consensus estimates.
Is now the time to buy Astronics? Find out by accessing our full research report, it’s free.
Astronics (ATRO) Q1 CY2025 Highlights:
- Revenue: $205.9 million vs analyst estimates of $191.9 million (11.3% year-on-year growth, 7.3% beat)
- Adjusted EPS: $0.44 vs analyst estimates of $0.30 (46.7% beat)
- Adjusted EBITDA: $30.74 million vs analyst estimates of $26.49 million (14.9% margin, 16% beat)
- The company reconfirmed its revenue guidance for the full year of $840 million at the midpoint
- Operating Margin: 6.4%, up from 0.6% in the same quarter last year
- Free Cash Flow Margin: 9%, up from 0.2% in the same quarter last year
- Backlog: $673 million at quarter end
- Market Capitalization: $839 million
Company Overview
Integrating power outlets into many Boeing aircraft, Astronics (NASDAQ: ATRO) is a provider of technologies and services to the global aerospace, defense, and electronics industries.
Sales Growth
A company’s long-term performance is an indicator of its overall quality. Any business can have short-term success, but a top-tier one grows for years. Over the last five years, Astronics grew its sales at a sluggish 2.5% compounded annual growth rate. This fell short of our benchmarks and is a rough starting point for our analysis.
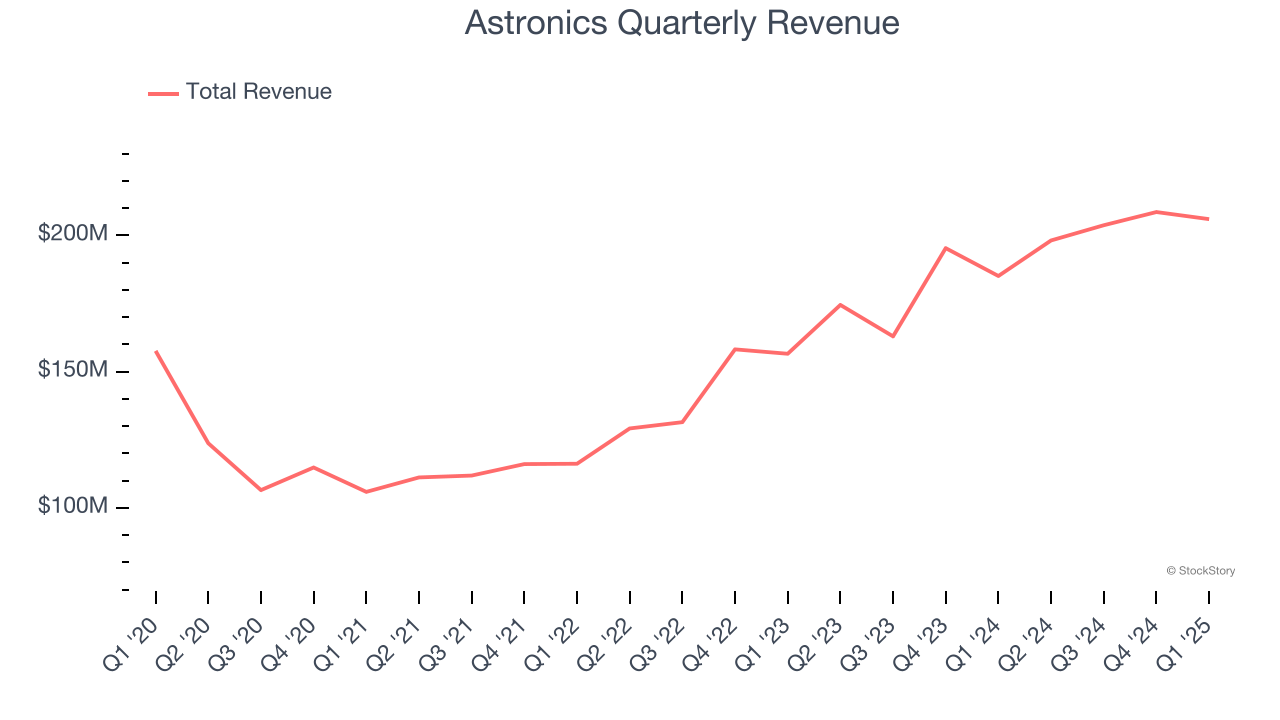
We at StockStory place the most emphasis on long-term growth, but within industrials, a half-decade historical view may miss cycles, industry trends, or a company capitalizing on catalysts such as a new contract win or a successful product line. Astronics’s annualized revenue growth of 19.1% over the last two years is above its five-year trend, suggesting its demand recently accelerated. 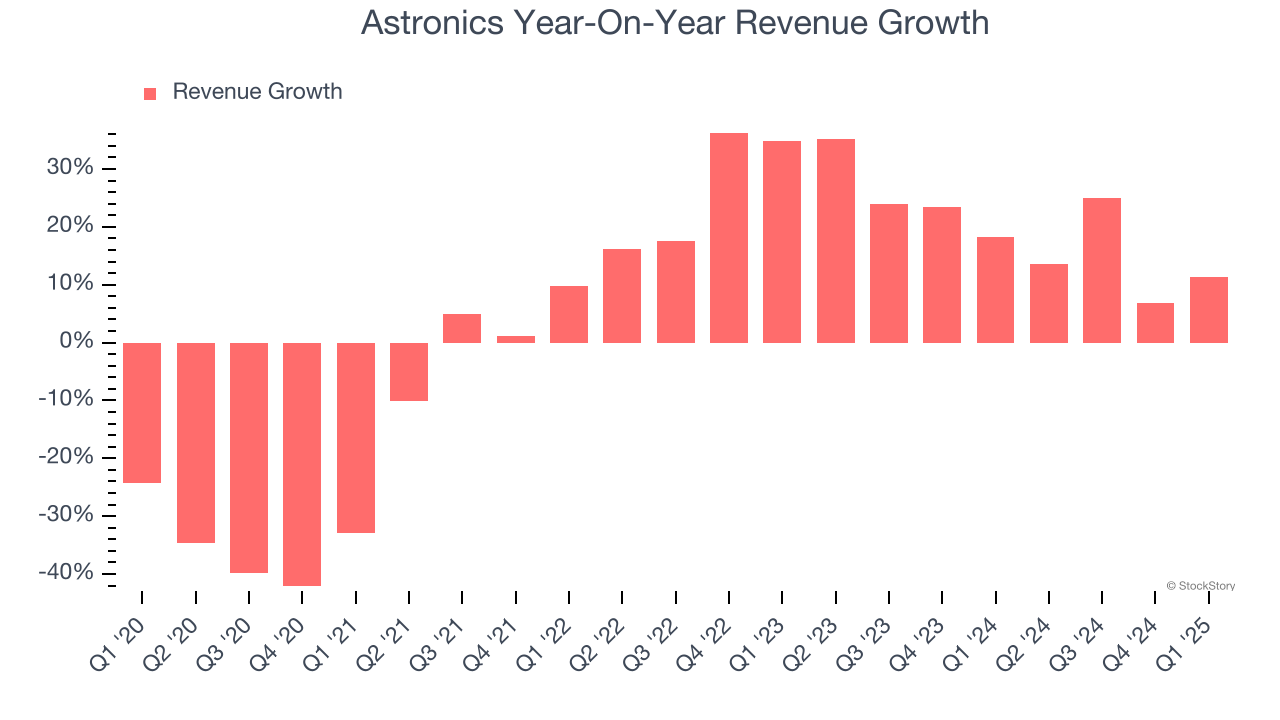
This quarter, Astronics reported year-on-year revenue growth of 11.3%, and its $205.9 million of revenue exceeded Wall Street’s estimates by 7.3%.
Looking ahead, sell-side analysts expect revenue to grow 3.5% over the next 12 months, a deceleration versus the last two years. This projection doesn't excite us and implies its products and services will face some demand challenges.
Software is eating the world and there is virtually no industry left that has been untouched by it. That drives increasing demand for tools helping software developers do their jobs, whether it be monitoring critical cloud infrastructure, integrating audio and video functionality, or ensuring smooth content streaming. Click here to access a free report on our 3 favorite stocks to play this generational megatrend.
Operating Margin
Although Astronics was profitable this quarter from an operational perspective, it’s generally struggled over a longer time period. Its expensive cost structure has contributed to an average operating margin of negative 2.4% over the last five years. Unprofitable industrials companies require extra attention because they could get caught swimming naked when the tide goes out. It’s hard to trust that the business can endure a full cycle.
On the plus side, Astronics’s operating margin rose by 11.4 percentage points over the last five years, as its sales growth gave it operating leverage. Still, it will take much more for the company to show consistent profitability.
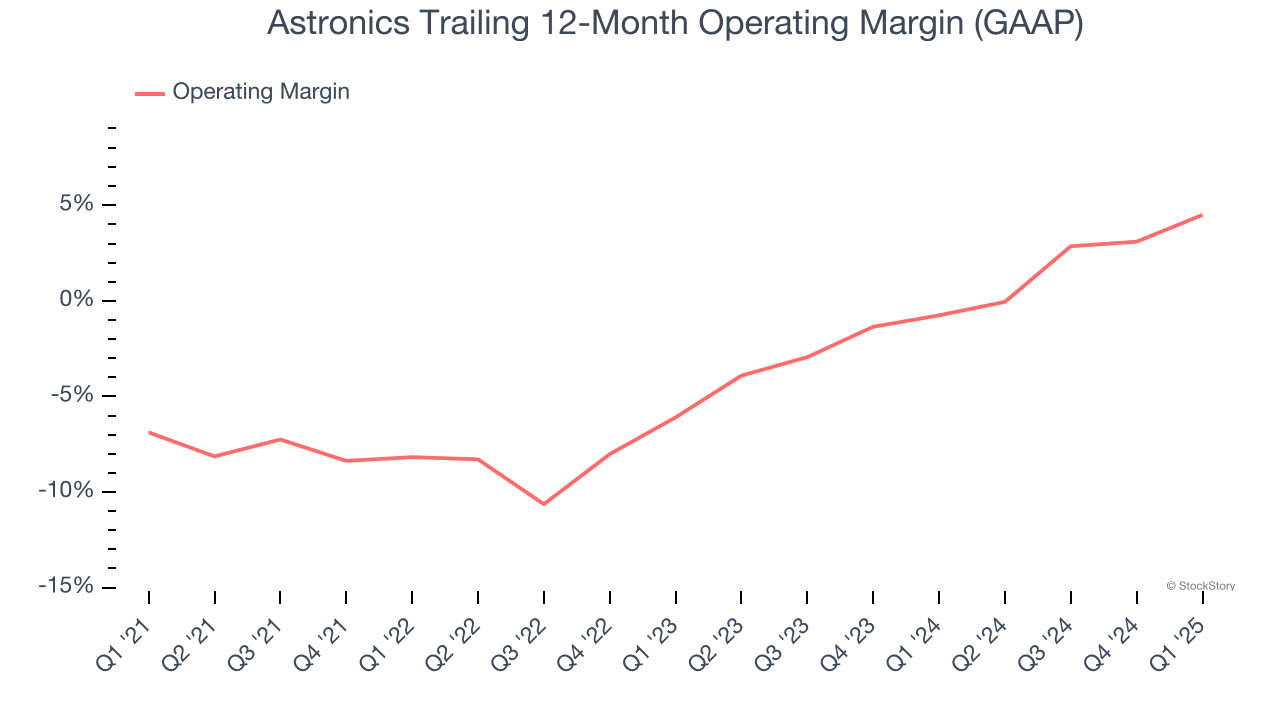
In Q1, Astronics generated an operating profit margin of 6.4%, up 5.8 percentage points year on year. This increase was a welcome development and shows it was more efficient.
Earnings Per Share
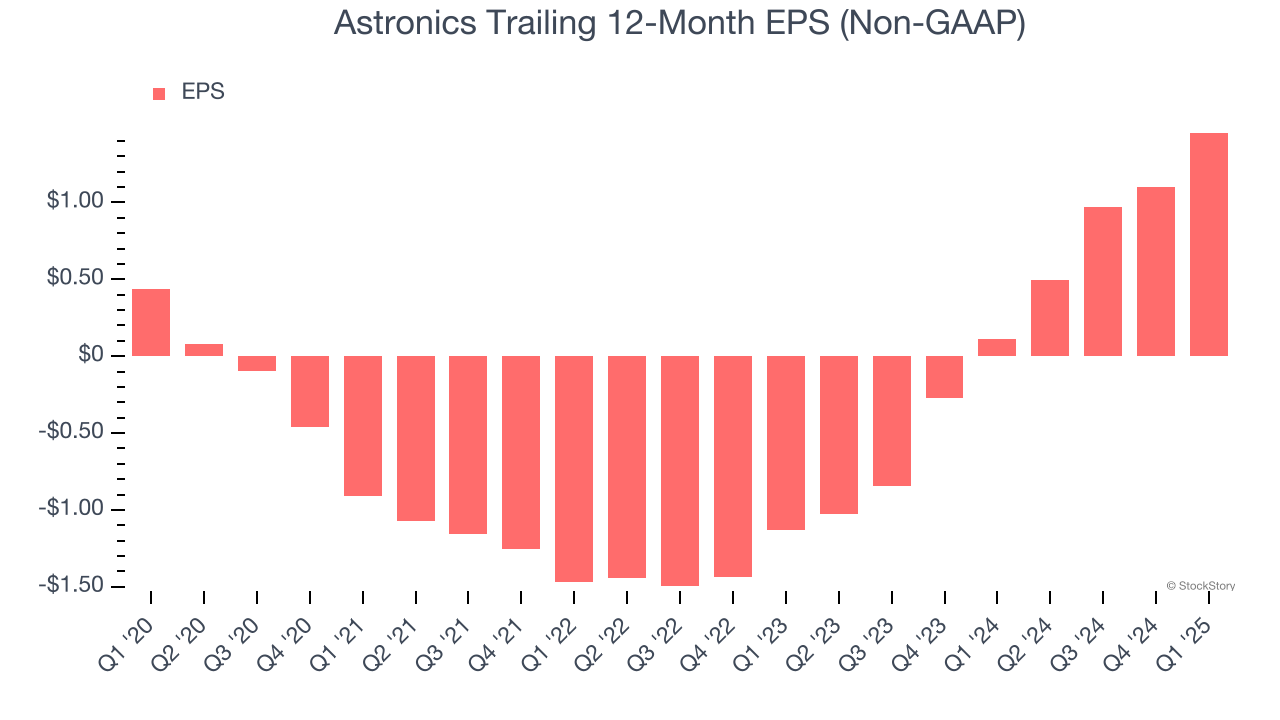
Revenue trends explain a company’s historical growth, but the long-term change in earnings per share (EPS) points to the profitability of that growth – for example, a company could inflate its sales through excessive spending on advertising and promotions.
Astronics’s EPS grew at an astounding 27% compounded annual growth rate over the last five years, higher than its 2.5% annualized revenue growth. This tells us the company became more profitable on a per-share basis as it expanded.
Diving into Astronics’s quality of earnings can give us a better understanding of its performance. As we mentioned earlier, Astronics’s operating margin expanded by 11.4 percentage points over the last five years. This was the most relevant factor (aside from the revenue impact) behind its higher earnings; taxes and interest expenses can also affect EPS but don’t tell us as much about a company’s fundamentals.
Like with revenue, we analyze EPS over a more recent period because it can provide insight into an emerging theme or development for the business.
For Astronics, its two-year annual EPS growth of 81.3% was higher than its five-year trend. We love it when earnings growth accelerates, especially when it accelerates off an already high base.
In Q1, Astronics reported EPS at $0.44, up from $0.08 in the same quarter last year. This print easily cleared analysts’ estimates, and shareholders should be content with the results. Over the next 12 months, Wall Street expects Astronics’s full-year EPS of $1.45 to grow 5.6%.
Key Takeaways from Astronics’s Q1 Results
We were impressed by how significantly Astronics blew past analysts’ EPS expectations this quarter. We were also excited its EBITDA outperformed Wall Street’s estimates by a wide margin. Zooming out, we think this was a solid print. The stock traded up 8.6% to $25.49 immediately after reporting.
Astronics had an encouraging quarter, but one earnings result doesn’t necessarily make the stock a buy. Let’s see if this is a good investment. When making that decision, it’s important to consider its valuation, business qualities, as well as what has happened in the latest quarter. We cover that in our actionable full research report which you can read here, it’s free.