Automotive services company Driven Brands (NASDAQ: DRVN) beat Wall Street’s revenue expectations in Q1 CY2025, but sales fell by 9.8% year on year to $516.2 million. The company expects the full year’s revenue to be around $2.1 billion, close to analysts’ estimates. Its non-GAAP profit of $0.27 per share was 12.9% above analysts’ consensus estimates.
Is now the time to buy Driven Brands? Find out by accessing our full research report, it’s free.
Driven Brands (DRVN) Q1 CY2025 Highlights:
- Revenue: $516.2 million vs analyst estimates of $502.3 million (9.8% year-on-year decline, 2.8% beat)
- Adjusted EPS: $0.27 vs analyst estimates of $0.24 (12.9% beat)
- Adjusted EBITDA: $125.1 million vs analyst estimates of $122.5 million (24.2% margin, 2.2% beat)
- The company reconfirmed its revenue guidance for the full year of $2.1 billion at the midpoint
- Management reiterated its full-year Adjusted EPS guidance of $1.20 at the midpoint
- EBITDA guidance for the full year is $535 million at the midpoint, below analyst estimates of $542.3 million
- Operating Margin: 11.9%, up from 10.2% in the same quarter last year
- Free Cash Flow was $18.9 million, up from -$29.2 million in the same quarter last year
- Same-Store Sales were flat year on year, in line with the same quarter last year
- Market Capitalization: $2.85 billion
“We delivered another strong quarter, led by the sustained momentum of our Take 5 Oil Change business, which achieved its 19th consecutive quarter of same store sales growth. Additionally, we successfully completed the sale of our U.S. car wash business in early April, primarily using the proceeds to reduce our debt. While the economic environment is fluid, our diversified portfolio, anchored by non-discretionary services, demonstrates resilience and positions us well for the long term. We are confident in our ability to deliver on our 2025 outlook and remain committed to paying down debt as we grow the business,” said Jonathan Fitzpatrick, President and Chief Executive Officer.
Company Overview
With approximately 5,000 locations across 49 U.S. states and 13 other countries, Driven Brands (NASDAQ: DRVN) operates a network of automotive service centers offering maintenance, car washes, paint, collision repair, and glass services across North America.
Sales Growth
Reviewing a company’s long-term sales performance reveals insights into its quality. Any business can put up a good quarter or two, but many enduring ones grow for years.
With $2.28 billion in revenue over the past 12 months, Driven Brands is a mid-sized business services company, which sometimes brings disadvantages compared to larger competitors benefiting from better economies of scale. On the bright side, it can still flex high growth rates because it’s working from a smaller revenue base.
As you can see below, Driven Brands’s sales grew at an incredible 28.4% compounded annual growth rate over the last five years. This shows it had high demand, a useful starting point for our analysis.
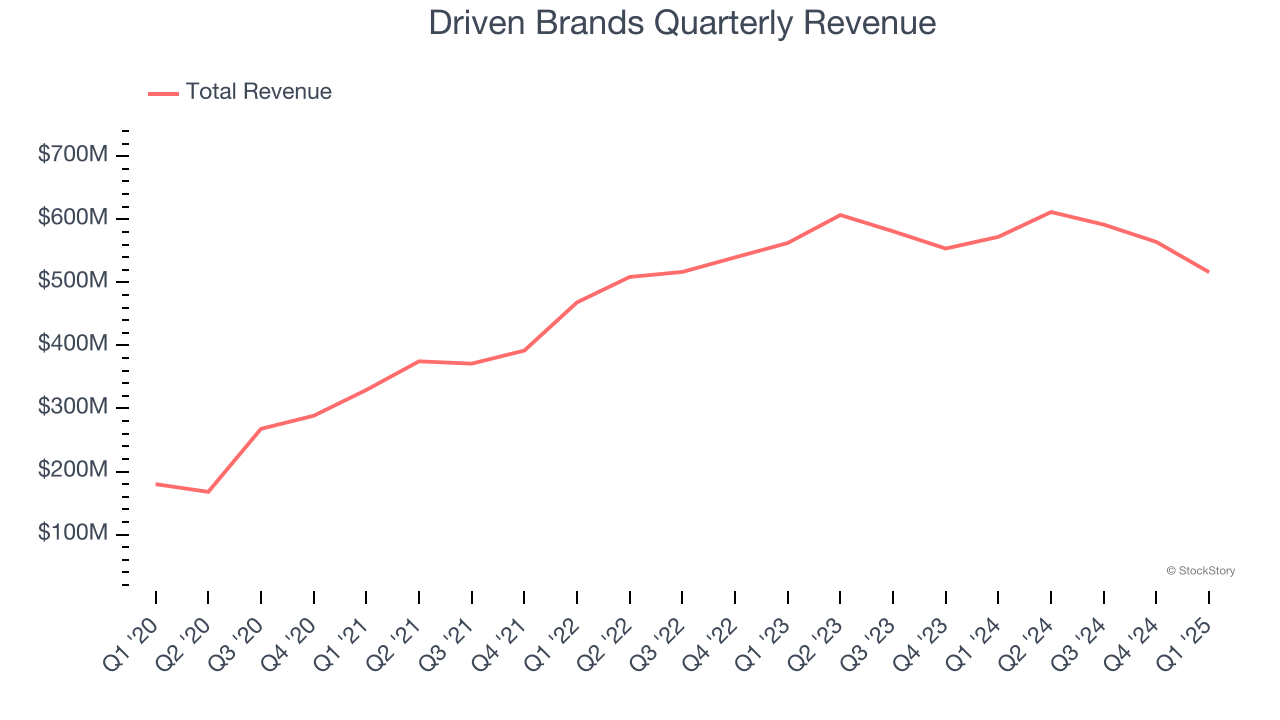
We at StockStory place the most emphasis on long-term growth, but within business services, a half-decade historical view may miss recent innovations or disruptive industry trends. Driven Brands’s recent performance shows its demand has slowed significantly as its annualized revenue growth of 3.6% over the last two years was well below its five-year trend. 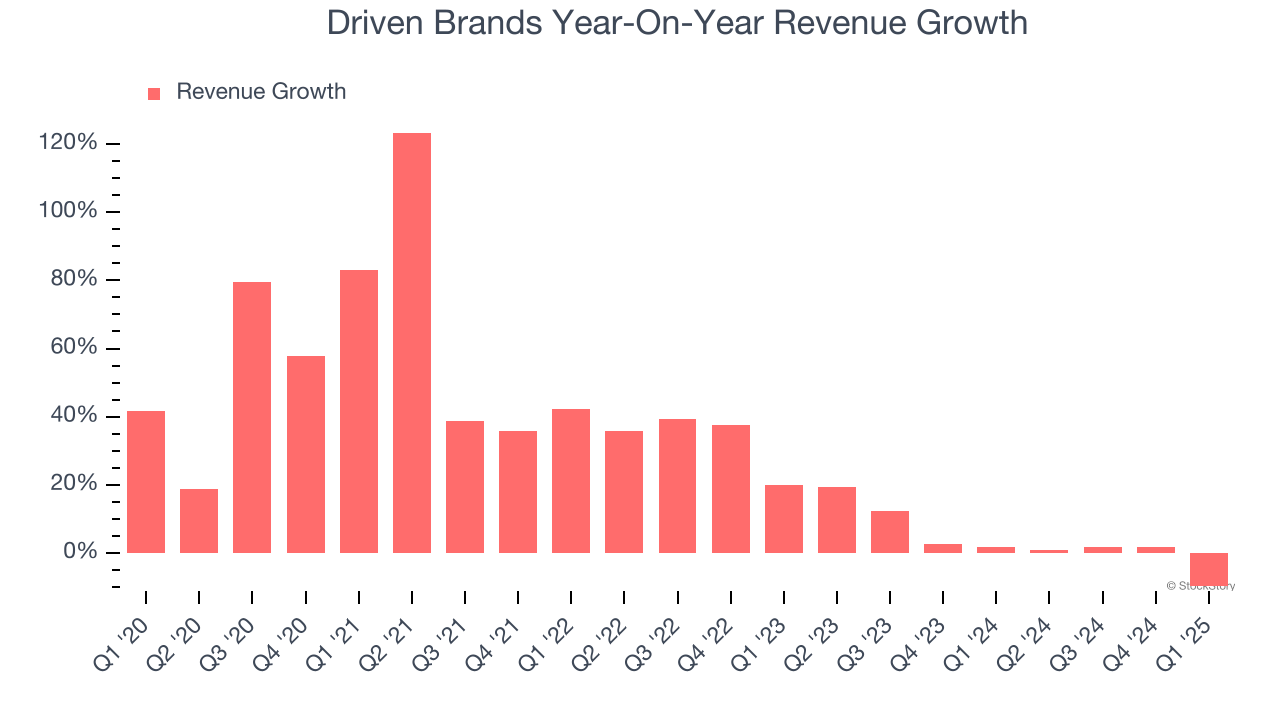
We can better understand the company’s revenue dynamics by analyzing its same-store sales, which show how much revenue its established locations generate. Over the last two years, Driven Brands’s same-store sales averaged 3.2% year-on-year growth. This number doesn’t surprise us as it’s in line with its revenue growth. 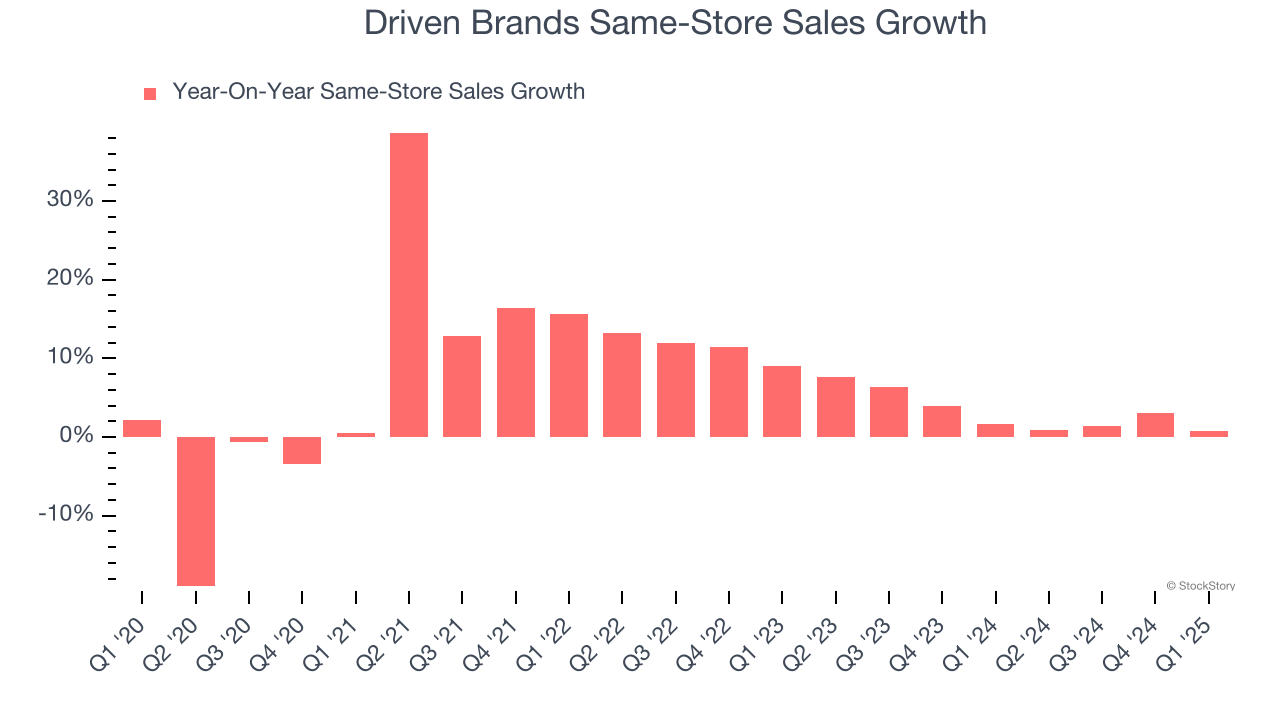
This quarter, Driven Brands’s revenue fell by 9.8% year on year to $516.2 million but beat Wall Street’s estimates by 2.8%.
Looking ahead, sell-side analysts expect revenue to decline by 4.3% over the next 12 months, a deceleration versus the last two years. This projection doesn't excite us and implies its products and services will face some demand challenges.
Here at StockStory, we certainly understand the potential of thematic investing. Diverse winners from Microsoft (MSFT) to Alphabet (GOOG), Coca-Cola (KO) to Monster Beverage (MNST) could all have been identified as promising growth stories with a megatrend driving the growth. So, in that spirit, we’ve identified a relatively under-the-radar profitable growth stock benefiting from the rise of AI, available to you FREE via this link.
Operating Margin
Operating margin is one of the best measures of profitability because it tells us how much money a company takes home after subtracting all core expenses, like marketing and R&D.
Although Driven Brands was profitable this quarter from an operational perspective, it’s generally struggled over a longer time period. Its expensive cost structure has contributed to an average operating margin of negative 3.3% over the last five years. Unprofitable business services companies require extra attention because they could get caught swimming naked when the tide goes out. It’s hard to trust that the business can endure a full cycle.
Looking at the trend in its profitability, Driven Brands’s operating margin decreased by 18.2 percentage points over the last five years. This raises questions about the company’s expense base because its revenue growth should have given it leverage on its fixed costs, resulting in better economies of scale and profitability. Driven Brands’s performance was poor no matter how you look at it - it shows that costs were rising and it couldn’t pass them onto its customers.
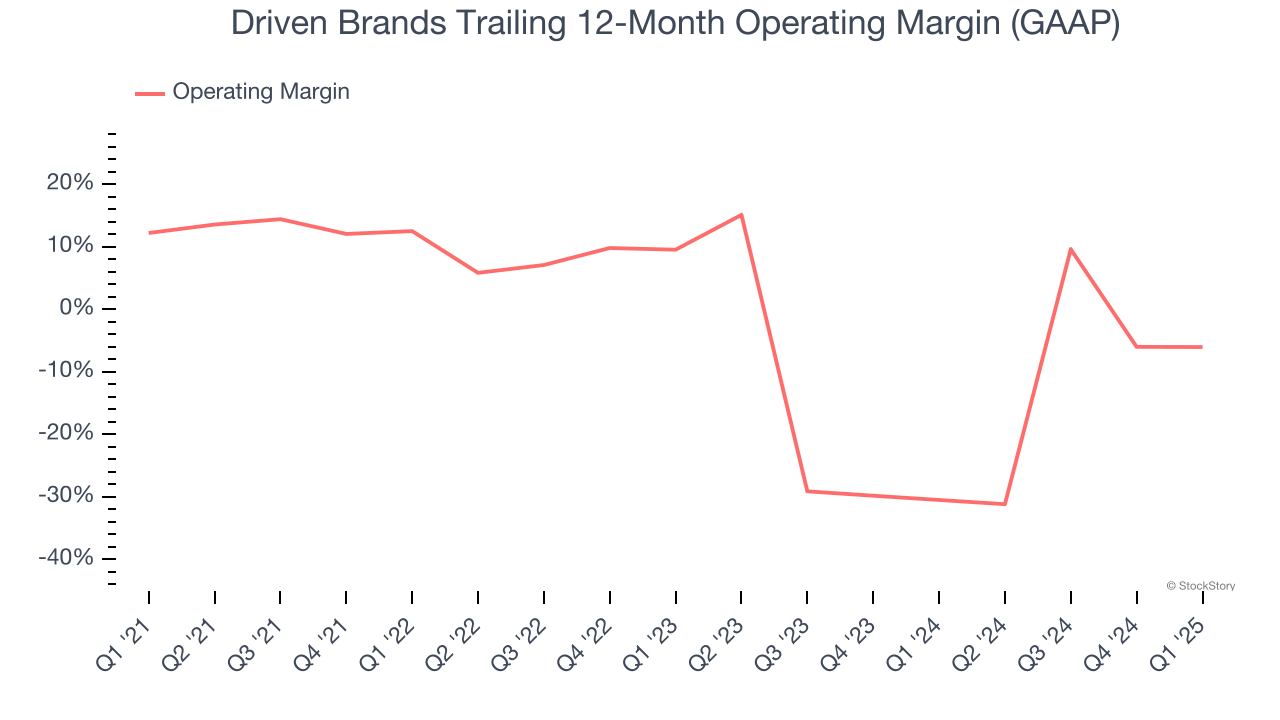
This quarter, Driven Brands generated an operating profit margin of 11.9%, up 1.6 percentage points year on year. This increase was a welcome development, especially since its revenue fell, showing it was more efficient because it scaled down its expenses.
Earnings Per Share
Revenue trends explain a company’s historical growth, but the long-term change in earnings per share (EPS) points to the profitability of that growth – for example, a company could inflate its sales through excessive spending on advertising and promotions.
Driven Brands’s astounding 28.8% annual EPS growth over the last five years aligns with its revenue performance. This tells us it maintained its per-share profitability as it expanded.
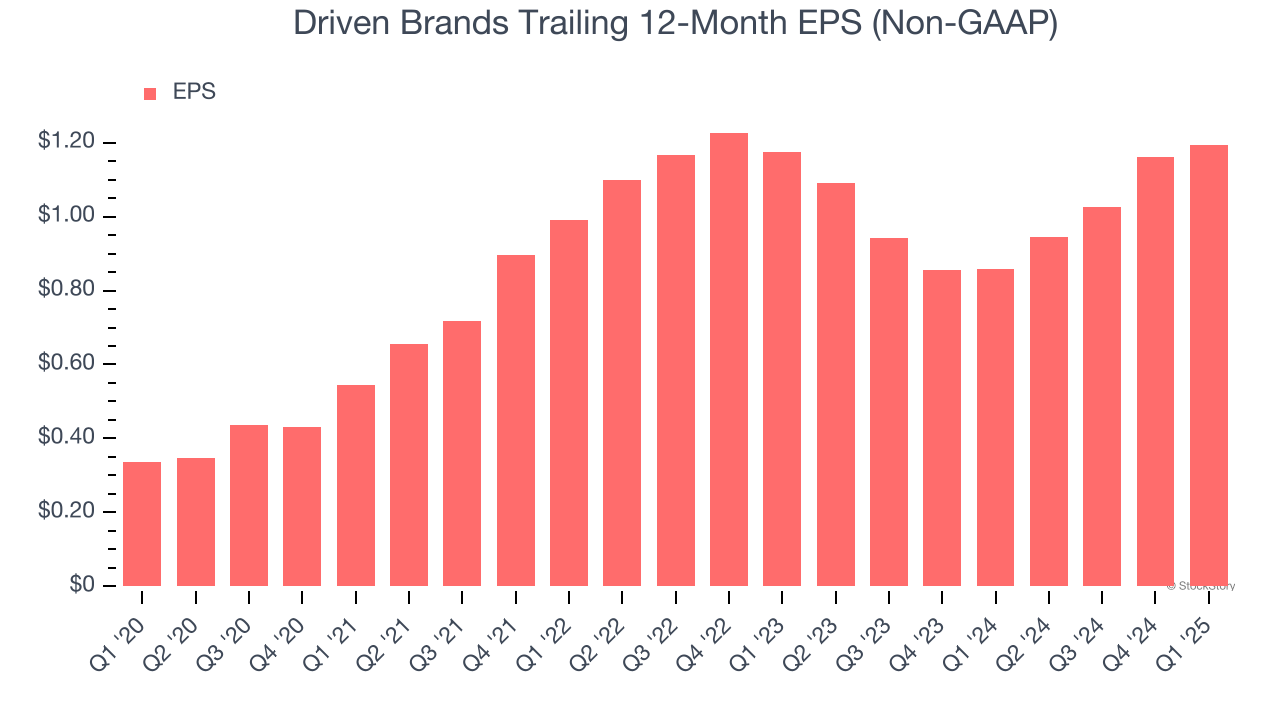
In Q1, Driven Brands reported EPS at $0.27, up from $0.24 in the same quarter last year. This print easily cleared analysts’ estimates, and shareholders should be content with the results. Over the next 12 months, Wall Street expects Driven Brands’s full-year EPS of $1.19 to grow 7.8%.
Key Takeaways from Driven Brands’s Q1 Results
We enjoyed seeing Driven Brands beat analysts’ EPS expectations this quarter. We were also glad its revenue outperformed Wall Street’s estimates. On the other hand, its full-year EPS guidance slightly missed and its same-store sales fell slightly short of Wall Street’s estimates. Overall, this print was mixed but still had some key positives. The stock traded up 1.1% to $17.52 immediately after reporting.
Driven Brands may have had a good quarter, but does that mean you should invest right now? We think that the latest quarter is only one piece of the longer-term business quality puzzle. Quality, when combined with valuation, can help determine if the stock is a buy. We cover that in our actionable full research report which you can read here, it’s free.