Landscaping service company BrightView (NYSE: BV) announced better-than-expected revenue in Q1 CY2025, but sales fell by 1.5% year on year to $662.6 million. The company’s full-year revenue guidance of $2.80 billion at the midpoint came in 0.8% above analysts’ estimates. Its non-GAAP profit of $0.14 per share was 27% above analysts’ consensus estimates.
Is now the time to buy BrightView? Find out by accessing our full research report, it’s free.
BrightView (BV) Q1 CY2025 Highlights:
- Revenue: $662.6 million vs analyst estimates of $646.6 million (1.5% year-on-year decline, 2.5% beat)
- Adjusted EPS: $0.14 vs analyst estimates of $0.11 (27% beat)
- Adjusted EBITDA: $56.3 million vs analyst estimates of $65.94 million (8.5% margin, 14.6% miss)
- The company reconfirmed its revenue guidance for the full year of $2.80 billion at the midpoint
- EBITDA guidance for the full year is $355 million at the midpoint, above analyst estimates of $347 million
- Operating Margin: 3.4%, down from 9.2% in the same quarter last year
- Free Cash Flow Margin: 8.7%, down from 10.7% in the same quarter last year
- Market Capitalization: $1.37 billion
Company Overview
An official field consultant for Major League Baseball, BrightView (NYSE: BV) offers landscaping design, development, and maintenance.
Sales Growth
A company’s long-term performance is an indicator of its overall quality. Even a bad business can shine for one or two quarters, but a top-tier one grows for years. Unfortunately, BrightView’s 2.5% annualized revenue growth over the last five years was sluggish. This fell short of our benchmarks and is a tough starting point for our analysis.
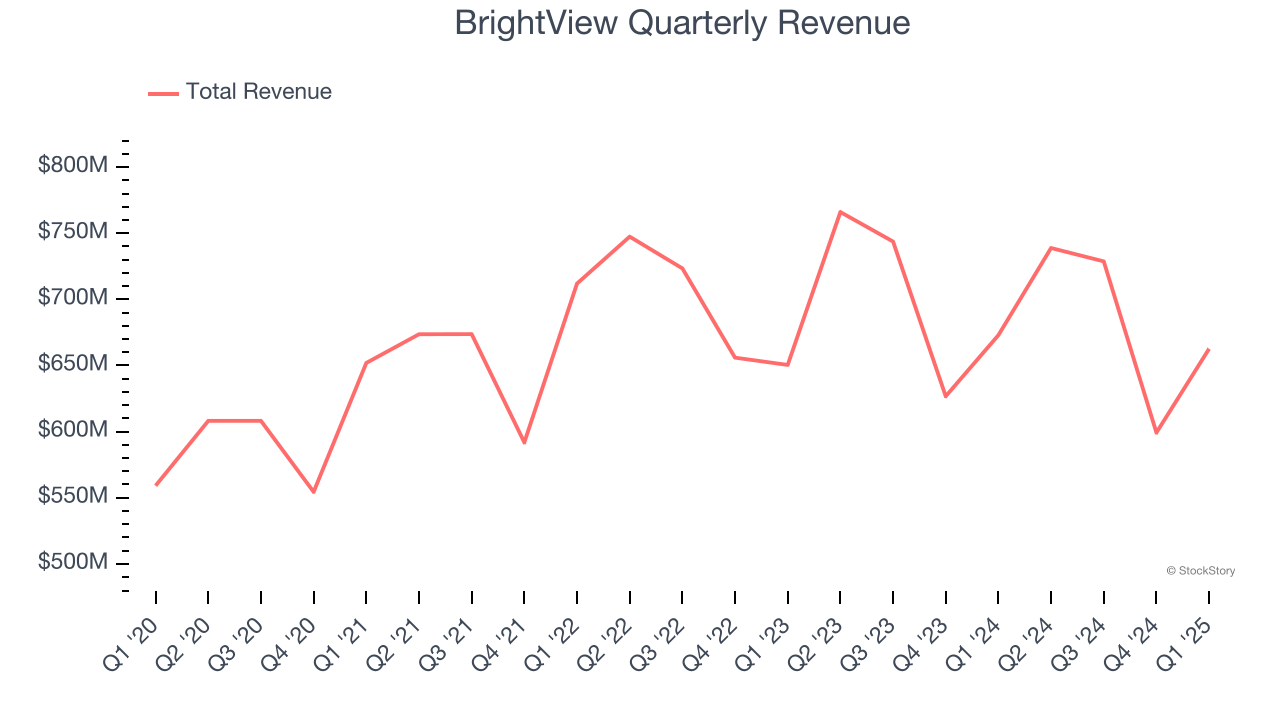
We at StockStory place the most emphasis on long-term growth, but within industrials, a half-decade historical view may miss cycles, industry trends, or a company capitalizing on catalysts such as a new contract win or a successful product line. BrightView’s recent performance shows its demand has slowed as its revenue was flat over the last two years. 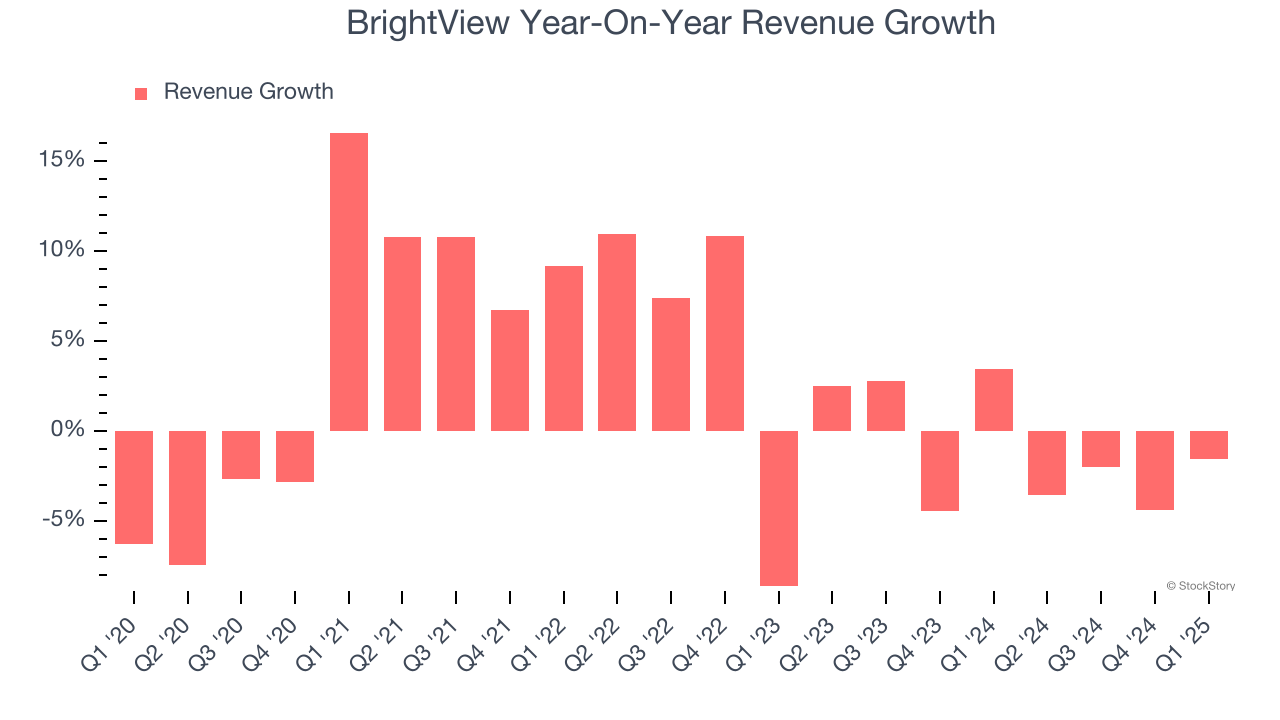
This quarter, BrightView’s revenue fell by 1.5% year on year to $662.6 million but beat Wall Street’s estimates by 2.5%.
Looking ahead, sell-side analysts expect revenue to grow 3.5% over the next 12 months. Although this projection indicates its newer products and services will spur better top-line performance, it is still below the sector average.
Here at StockStory, we certainly understand the potential of thematic investing. Diverse winners from Microsoft (MSFT) to Alphabet (GOOG), Coca-Cola (KO) to Monster Beverage (MNST) could all have been identified as promising growth stories with a megatrend driving the growth. So, in that spirit, we’ve identified a relatively under-the-radar profitable growth stock benefiting from the rise of AI, available to you FREE via this link.
Operating Margin
BrightView was profitable over the last five years but held back by its large cost base. Its average operating margin of 3.6% was weak for an industrials business. This result isn’t too surprising given its low gross margin as a starting point.
On the plus side, BrightView’s operating margin rose by 3 percentage points over the last five years, as its sales growth gave it operating leverage.
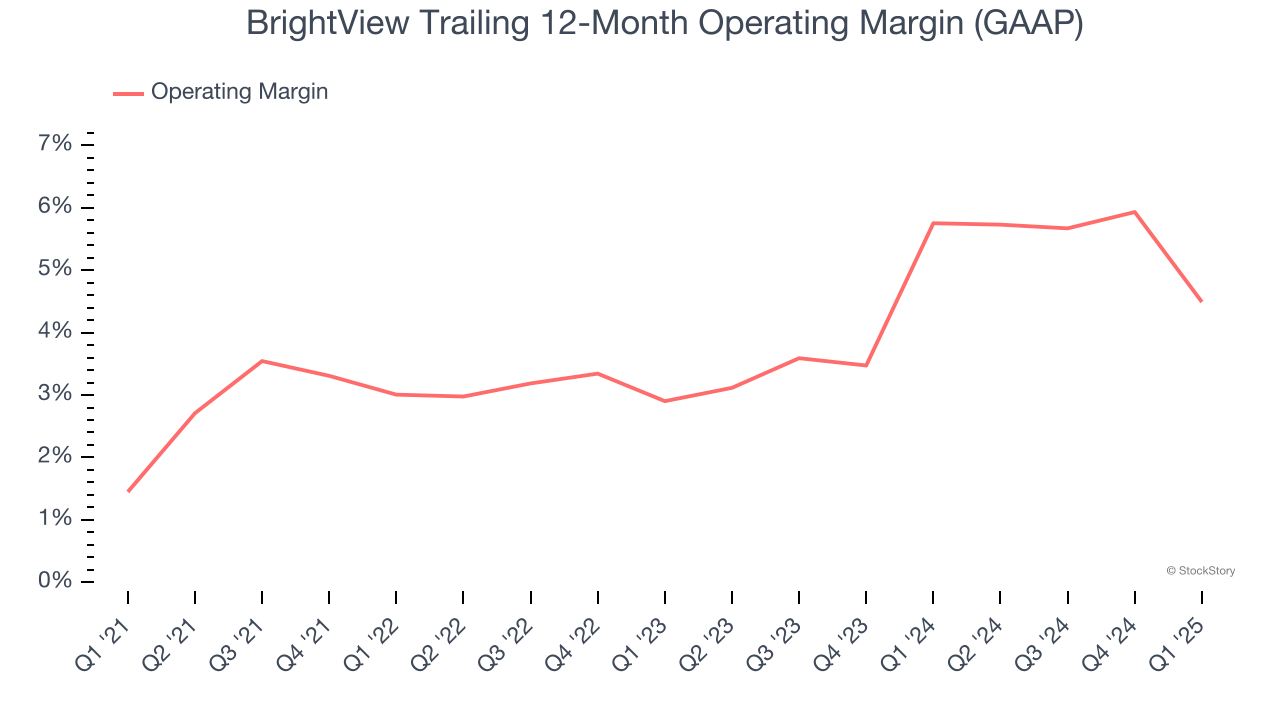
This quarter, BrightView generated an operating profit margin of 3.4%, down 5.9 percentage points year on year. Since BrightView’s operating margin decreased more than its gross margin, we can assume it was less efficient because expenses such as marketing, R&D, and administrative overhead increased.
Earnings Per Share
We track the long-term change in earnings per share (EPS) for the same reason as long-term revenue growth. Compared to revenue, however, EPS highlights whether a company’s growth is profitable.
Sadly for BrightView, its EPS declined by 2.9% annually over the last five years while its revenue grew by 2.5%. We can see the difference stemmed from higher interest expenses or taxes as the company actually grew its operating margin and repurchased its shares during this time.
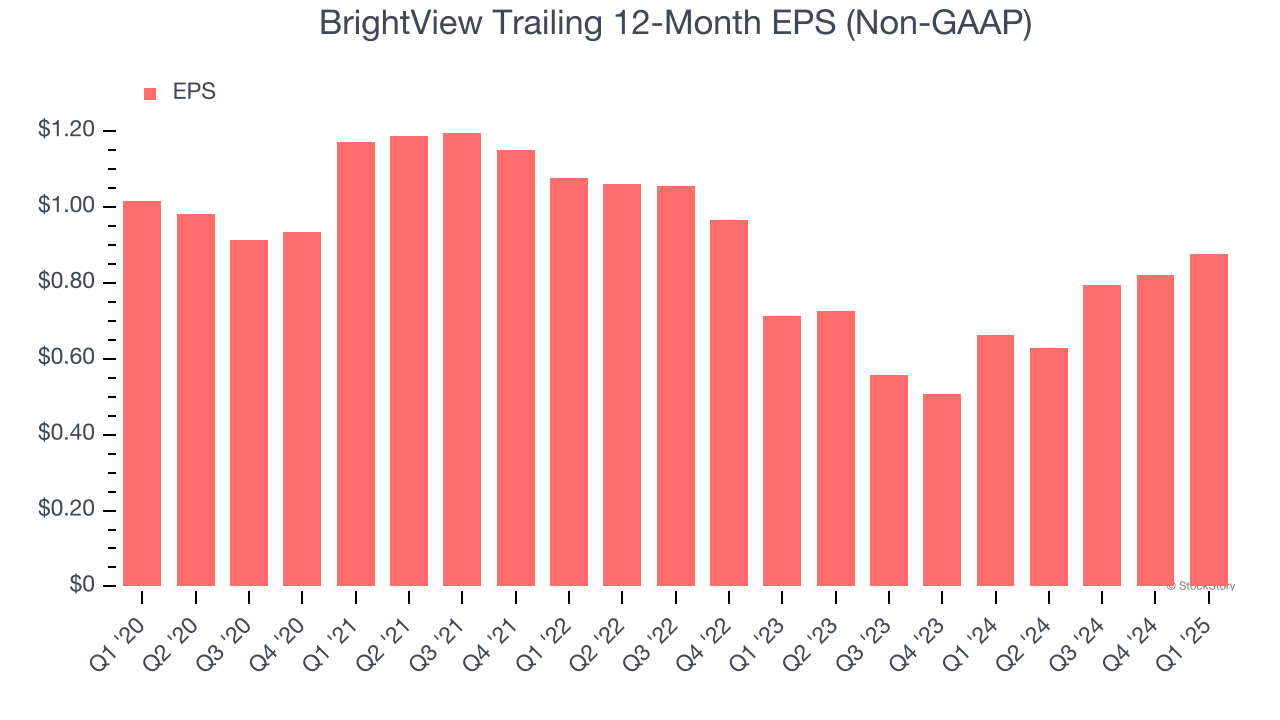
Like with revenue, we analyze EPS over a shorter period to see if we are missing a change in the business.
BrightView’s two-year annual EPS growth of 11% was good and topped its flat revenue.
In Q1, BrightView reported EPS at $0.14, up from $0.08 in the same quarter last year. This print easily cleared analysts’ estimates, and shareholders should be content with the results. Over the next 12 months, Wall Street expects BrightView’s full-year EPS of $0.88 to grow 1.4%.
Key Takeaways from BrightView’s Q1 Results
We were impressed by how significantly BrightView blew past analysts’ EPS expectations this quarter. We were also glad its full-year EBITDA guidance exceeded Wall Street’s estimates. On the other hand, its EBITDA missed significantly. Overall, we think this was a decent quarter with some key metrics above expectations. The stock traded up 4.7% to $15.22 immediately after reporting.
BrightView may have had a good quarter, but does that mean you should invest right now? If you’re making that decision, you should consider the bigger picture of valuation, business qualities, as well as the latest earnings. We cover that in our actionable full research report which you can read here, it’s free.