Arcade company Dave & Buster’s (NASDAQ: PLAY) met Wall Street’s revenue expectations in Q1 CY2025, but sales fell by 3.5% year on year to $567.7 million. Its non-GAAP profit of $0.76 per share was 25% below analysts’ consensus estimates.
Is now the time to buy Dave & Buster's? Find out by accessing our full research report, it’s free.
Dave & Buster's (PLAY) Q1 CY2025 Highlights:
- Revenue: $567.7 million vs analyst estimates of $568.4 million (3.5% year-on-year decline, in line)
- Adjusted EPS: $0.76 vs analyst expectations of $1.01 (25% miss)
- Adjusted EBITDA: $136.1 million vs analyst estimates of $137.4 million (24% margin, 0.9% miss)
- Operating Margin: 11.1%, down from 14.5% in the same quarter last year
- Free Cash Flow was $95.8 million, up from -$4.2 million in the same quarter last year
- Same-Store Sales fell 8.3% year on year (-3.8% in the same quarter last year)
- Market Capitalization: $883.7 million
“I am pleased to report that we are making good progress and our operating results significantly improved over the course of the first quarter. While performance in the first quarter was nowhere close to where we want and expect to be, our “back to basics” strategy is working and is driving a material recovery in our top-line trajectory.
Company Overview
Founded by a former game parlor and bar operator, Dave & Buster’s (NASDAQ: PLAY) operates a chain of arcades providing immersive entertainment experiences.
Sales Growth
Examining a company’s long-term performance can provide clues about its quality. Any business can experience short-term success, but top-performing ones enjoy sustained growth for years. Over the last five years, Dave & Buster's grew its sales at a 12.9% annual rate. Although this growth is acceptable on an absolute basis, it fell short of our standards for the consumer discretionary sector, which enjoys a number of secular tailwinds.
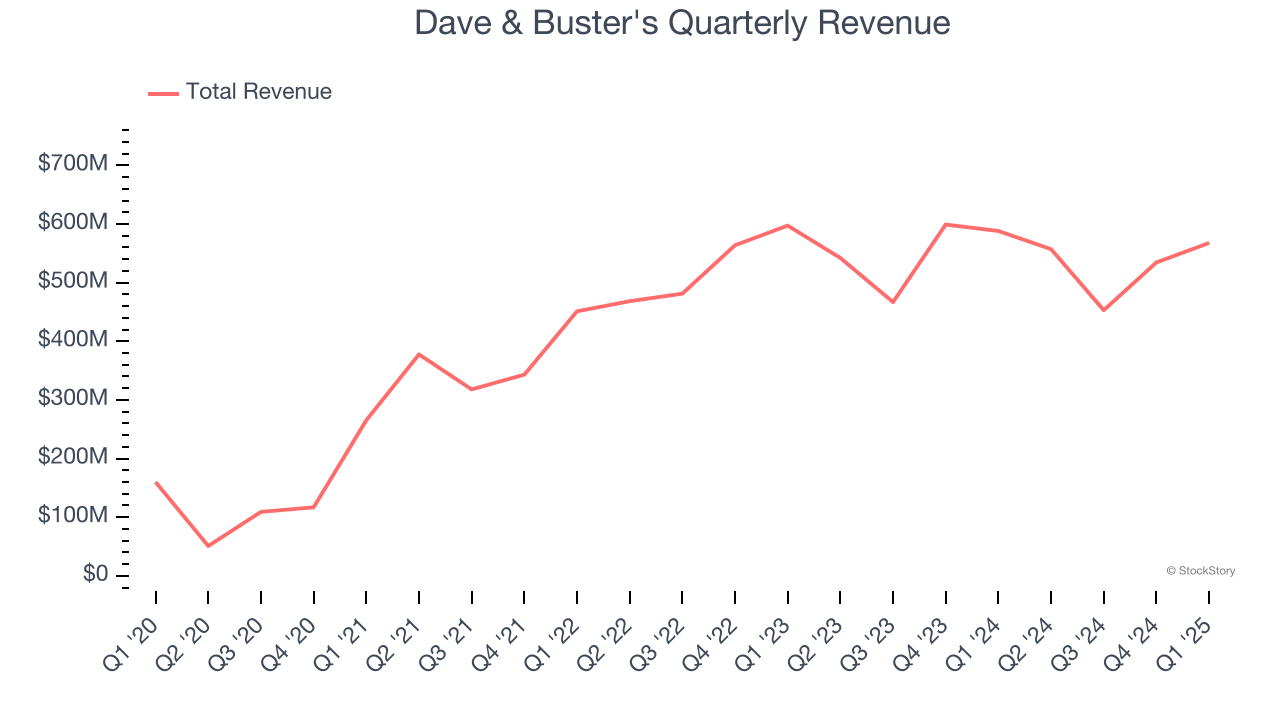
We at StockStory place the most emphasis on long-term growth, but within consumer discretionary, a stretched historical view may miss a company riding a successful new product or trend. Dave & Buster’s recent performance shows its demand has slowed as its revenue was flat over the last two years. Note that COVID hurt Dave & Buster’s business in 2020 and part of 2021, and it bounced back in a big way thereafter. 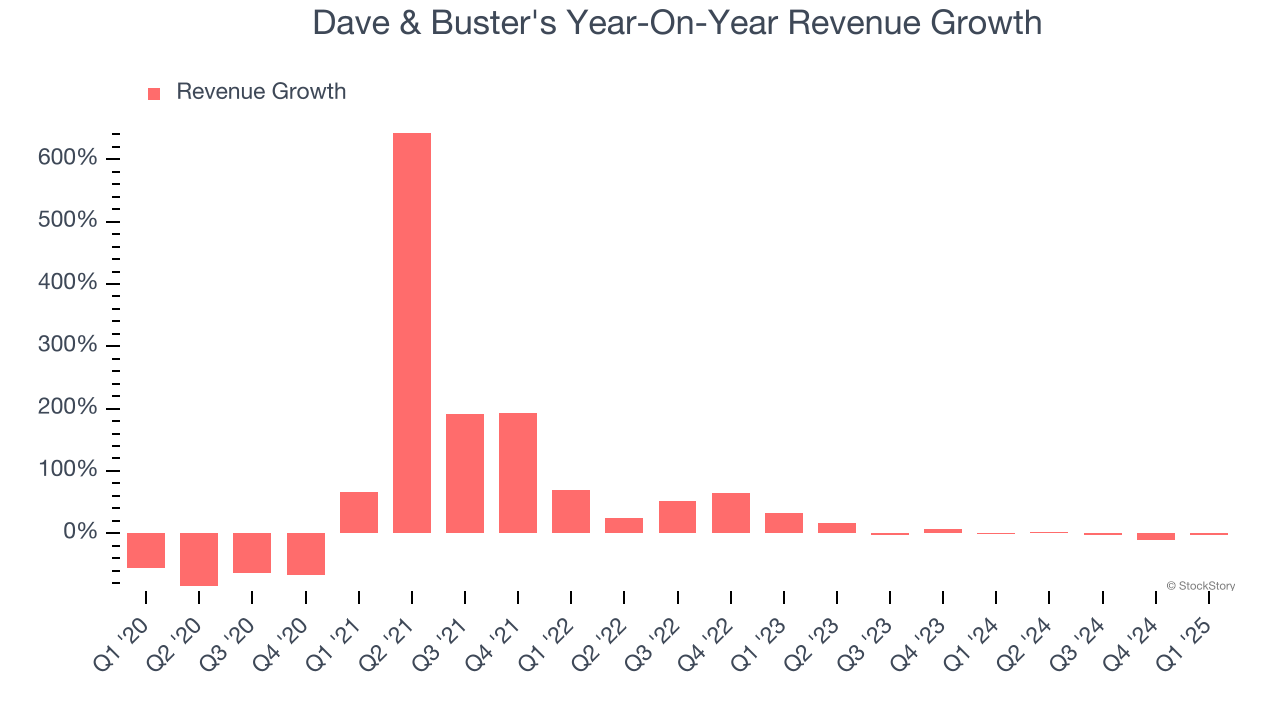
Dave & Buster's also reports same-store sales, which show how much revenue its established locations generate. Over the last two years, Dave & Buster’s same-store sales averaged 4.9% year-on-year declines. Because this number is lower than its revenue growth, we can see the opening of new locations is boosting the company’s top-line performance. 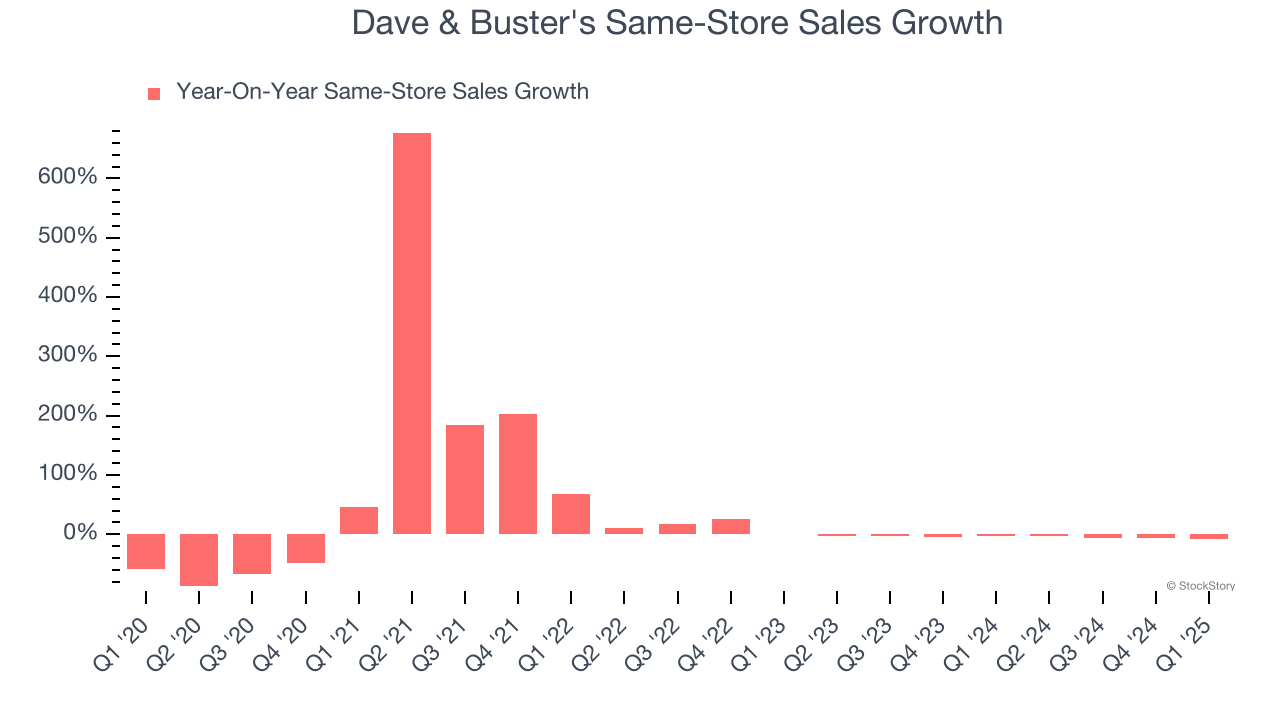
This quarter, Dave & Buster's reported a rather uninspiring 3.5% year-on-year revenue decline to $567.7 million of revenue, in line with Wall Street’s estimates.
Looking ahead, sell-side analysts expect revenue to grow 3.1% over the next 12 months. While this projection indicates its newer products and services will fuel better top-line performance, it is still below the sector average.
Software is eating the world and there is virtually no industry left that has been untouched by it. That drives increasing demand for tools helping software developers do their jobs, whether it be monitoring critical cloud infrastructure, integrating audio and video functionality, or ensuring smooth content streaming. Click here to access a free report on our 3 favorite stocks to play this generational megatrend.
Operating Margin
Operating margin is an important measure of profitability as it shows the portion of revenue left after accounting for all core expenses – everything from the cost of goods sold to advertising and wages. It’s also useful for comparing profitability across companies with different levels of debt and tax rates because it excludes interest and taxes.
Dave & Buster’s operating margin has been trending down over the last 12 months, but it still averaged 10.9% over the last two years, decent for a consumer discretionary business. This shows it generally does a decent job managing its expenses.
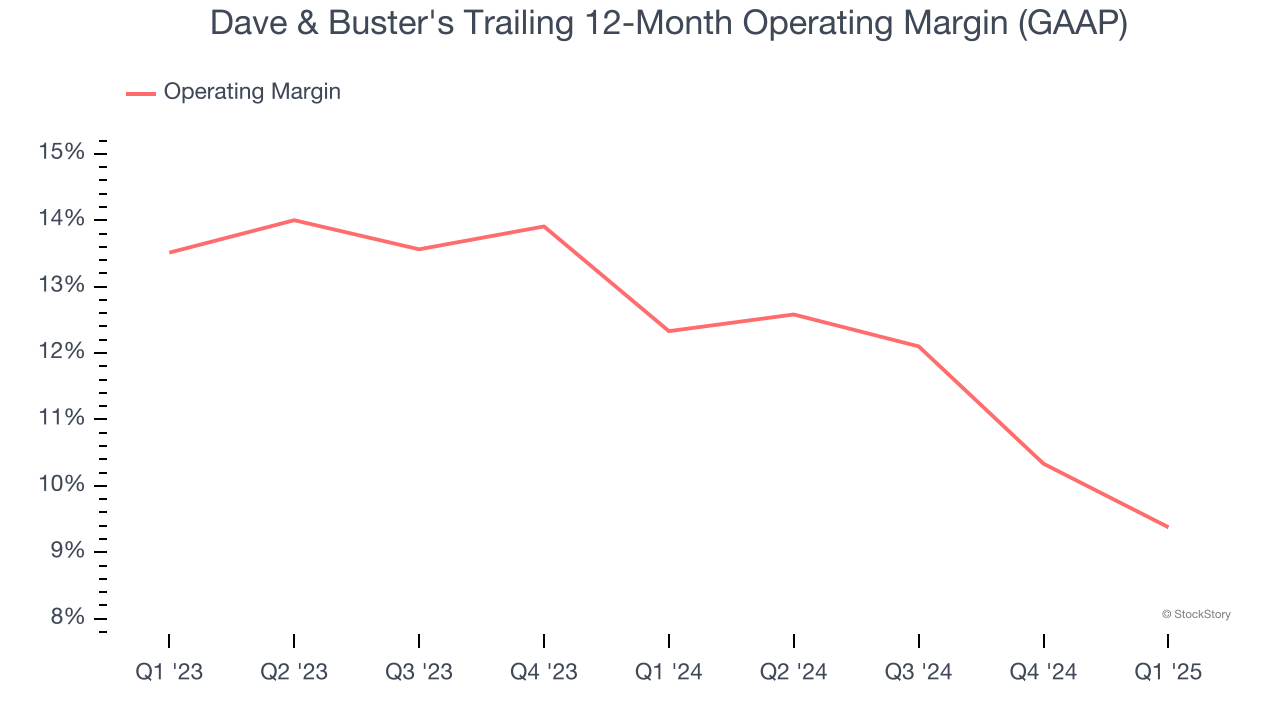
In Q1, Dave & Buster's generated an operating margin profit margin of 11.1%, down 3.4 percentage points year on year. This contraction shows it was less efficient because its expenses increased relative to its revenue.
Earnings Per Share
We track the long-term change in earnings per share (EPS) for the same reason as long-term revenue growth. Compared to revenue, however, EPS highlights whether a company’s growth is profitable.
Dave & Buster’s EPS grew at an astounding 35.9% compounded annual growth rate over the last five years, higher than its 12.9% annualized revenue growth. This tells us the company became more profitable on a per-share basis as it expanded.
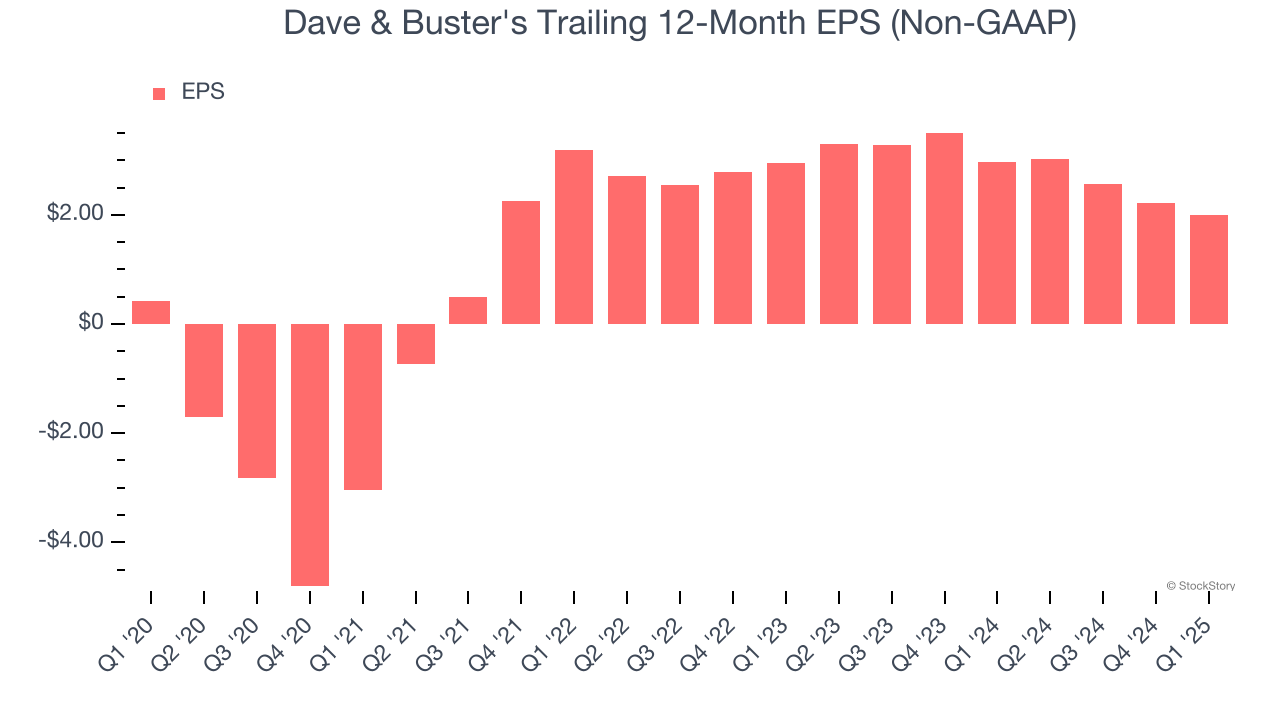
In Q1, Dave & Buster's reported EPS at $0.76, down from $0.99 in the same quarter last year. This print missed analysts’ estimates, but we care more about long-term EPS growth than short-term movements. Over the next 12 months, Wall Street expects Dave & Buster’s full-year EPS of $1.99 to grow 7%.
Key Takeaways from Dave & Buster’s Q1 Results
We struggled to find many positives in these results as its EPS and same-store sales fell short of Wall Street’s estimates. Overall, this was a weaker quarter. The stock traded down 4.9% to $24.60 immediately following the results.
Dave & Buster's underperformed this quarter, but does that create an opportunity to invest right now? We think that the latest quarter is only one piece of the longer-term business quality puzzle. Quality, when combined with valuation, can help determine if the stock is a buy. We cover that in our actionable full research report which you can read here, it’s free.