
Wrapping up Q1 earnings, we look at the numbers and key takeaways for the property & casualty insurance stocks, including Old Republic International (NYSE: ORI) and its peers.
Property & Casualty (P&C) insurers protect individuals and businesses against financial loss from damage to property or from legal liability. This is a cyclical industry, and the sector benefits when there is 'hard market', characterized by strong premium rate increases that outpace loss and cost inflation, resulting in robust underwriting margins. The opposite is true in a 'soft market'. Interest rates also matter, as they determine the yields earned on fixed-income portfolios. On the other hand, P&C insurers face a major secular headwind from the increasing frequency and severity of catastrophe losses due to climate change. Furthermore, the liability side of the business is pressured by 'social inflation'—the trend of rising litigation costs and larger jury awards.
The 33 property & casualty insurance stocks we track reported a mixed Q1. As a group, revenues beat analysts’ consensus estimates by 2.4%.
In light of this news, share prices of the companies have held steady. On average, they are relatively unchanged since the latest earnings results.
Old Republic International (NYSE: ORI)
Founded during the Roaring Twenties in 1923 and weathering nearly a century of economic cycles, Old Republic International (NYSE: ORI) is a diversified insurance holding company that provides property, liability, title, and mortgage guaranty insurance through its various subsidiaries.
Old Republic International reported revenues of $2.11 billion, up 4.9% year on year. This print exceeded analysts’ expectations by 2.5%. Overall, it was a strong quarter for the company with an impressive beat of analysts’ book value per share estimates and a decent beat of analysts’ EPS estimates.
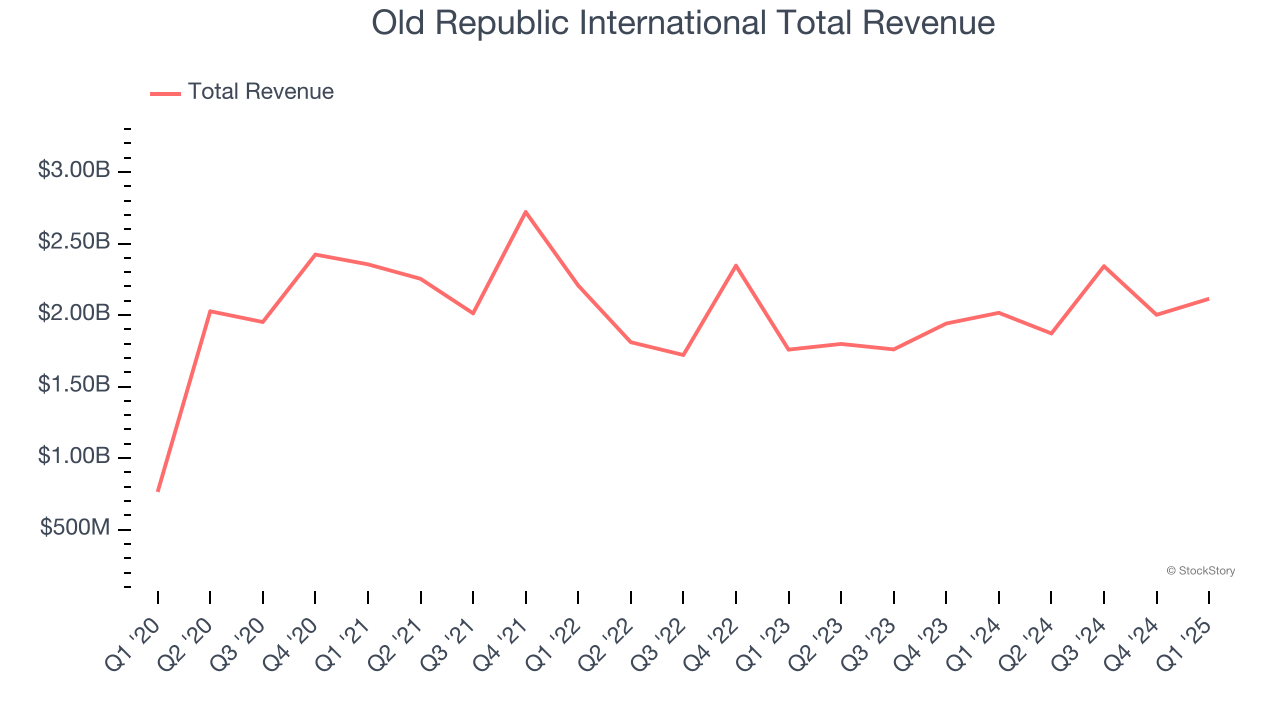
Unsurprisingly, the stock is down 1.3% since reporting and currently trades at $37.44.
Is now the time to buy Old Republic International? Access our full analysis of the earnings results here, it’s free.
Best Q1: Root (NASDAQ: ROOT)
Pioneering a data-driven approach that rewards good driving habits, Root (NASDAQ: ROOT) is a technology-driven auto insurance company that uses mobile apps to acquire customers and data science to price policies based on individual driving behavior.
Root reported revenues of $349.4 million, up 37.1% year on year, outperforming analysts’ expectations by 9.1%. The business had an incredible quarter with an impressive beat of analysts’ EPS and net premiums earned estimates.

Although it had a fine quarter compared its peers, the market seems unhappy with the results as the stock is down 12.1% since reporting. It currently trades at $123.30.
Is now the time to buy Root? Access our full analysis of the earnings results here, it’s free.
Weakest Q1: Fidelity National Financial (NYSE: FNF)
Issuing more title insurance policies than any other company in the United States, Fidelity National Financial (NYSE: FNF) provides title insurance and escrow services for real estate transactions while also offering annuities and life insurance through its F&G subsidiary.
Fidelity National Financial reported revenues of $2.73 billion, down 17.3% year on year, falling short of analysts’ expectations by 17.9%. It was a disappointing quarter as it posted a significant miss of analysts’ EPS estimates.
Fidelity National Financial delivered the weakest performance against analyst estimates in the group. As expected, the stock is down 12.6% since the results and currently trades at $56.26.
Read our full analysis of Fidelity National Financial’s results here.
Markel Group (NYSE: MKL)
Often referred to as a "mini Berkshire Hathaway" for its three-engine business model of insurance, investments, and wholly-owned businesses, Markel Group (NYSE: MKL) is a specialty insurance company that underwrites complex risks, manages investment portfolios, and owns a diverse collection of operating businesses.
Markel Group reported revenues of $3.40 billion, down 23.9% year on year. This print lagged analysts' expectations by 6.1%. Aside from that, it was a mixed quarter as it also produced a solid beat of analysts’ EPS estimates but a miss of analysts’ book value per share estimates.
Markel Group had the slowest revenue growth among its peers. The stock is up 9.1% since reporting and currently trades at $1,985.
Read our full, actionable report on Markel Group here, it’s free.
NMI Holdings (NASDAQ: NMIH)
Founded in the aftermath of the 2008 housing crisis to bring new capacity to the mortgage insurance market, NMI Holdings (NASDAQ: NMIH) provides mortgage insurance that protects lenders against losses when homebuyers default on their mortgage loans.
NMI Holdings reported revenues of $173.2 million, up 10.9% year on year. This result beat analysts’ expectations by 3%. It was an exceptional quarter as it also recorded an impressive beat of analysts’ EPS estimates.
The stock is flat since reporting and currently trades at $39.52.
Read our full, actionable report on NMI Holdings here, it’s free.
Market Update
Thanks to the Fed’s series of rate hikes in 2022 and 2023, inflation has cooled significantly from its post-pandemic highs, drawing closer to the 2% goal. This disinflation has occurred without severely impacting economic growth, suggesting the success of a soft landing. The stock market thrived in 2024, spurred by recent rate cuts (0.5% in September and 0.25% in November), and a notable surge followed Donald Trump’s presidential election win in November, propelling indices to historic highs. Nonetheless, the outlook for 2025 remains clouded by potential trade policy changes and corporate tax discussions, which could impact business confidence and growth. The path forward holds both optimism and caution as new policies take shape.
Want to invest in winners with rock-solid fundamentals? Check out our Hidden Gem Stocks and add them to your watchlist. These companies are poised for growth regardless of the political or macroeconomic climate.
StockStory is growing and hiring equity analyst and marketing roles. Are you a 0 to 1 builder passionate about the markets and AI? See the open roles here.