Industrial technology company Fortive (NYSE: FTV) met Wall Street’s revenue expectations in Q2 CY2025, but sales were flat year on year at $1.02 billion. Its non-GAAP profit of $0.58 per share was 2.1% below analysts’ consensus estimates.
Is now the time to buy Fortive? Find out by accessing our full research report, it’s free.
Fortive (FTV) Q2 CY2025 Highlights:
- Revenue: $1.02 billion vs analyst estimates of $1.01 billion (flat year on year, in line)
- Adjusted EPS: $0.58 vs analyst expectations of $0.59 (2.1% miss)
- Adjusted EBITDA: $288 million vs analyst estimates of $286.2 million (28.3% margin, 0.6% beat)
- Management lowered its full-year Adjusted EPS guidance to $2.55 at the midpoint, a 34.6% decrease
- Operating Margin: 16.7%, down from 17.9% in the same quarter last year
- Free Cash Flow Margin: 48.2%, up from 19.4% in the same quarter last year
- Market Capitalization: $17.31 billion
“The second quarter of 2025 was pivotal for Fortive,” said Olumide Soroye, President and CEO.
Company Overview
Taking its name from the Latin root of "strong", Fortive (NYSE: FTV) manufactures products and develops industrial software for numerous industries.
Revenue Growth
A company’s long-term performance is an indicator of its overall quality. Any business can have short-term success, but a top-tier one grows for years. Fortive’s demand was weak over the last five years as its sales fell at a 2.2% annual rate. This was below our standards and suggests it’s a low quality business.
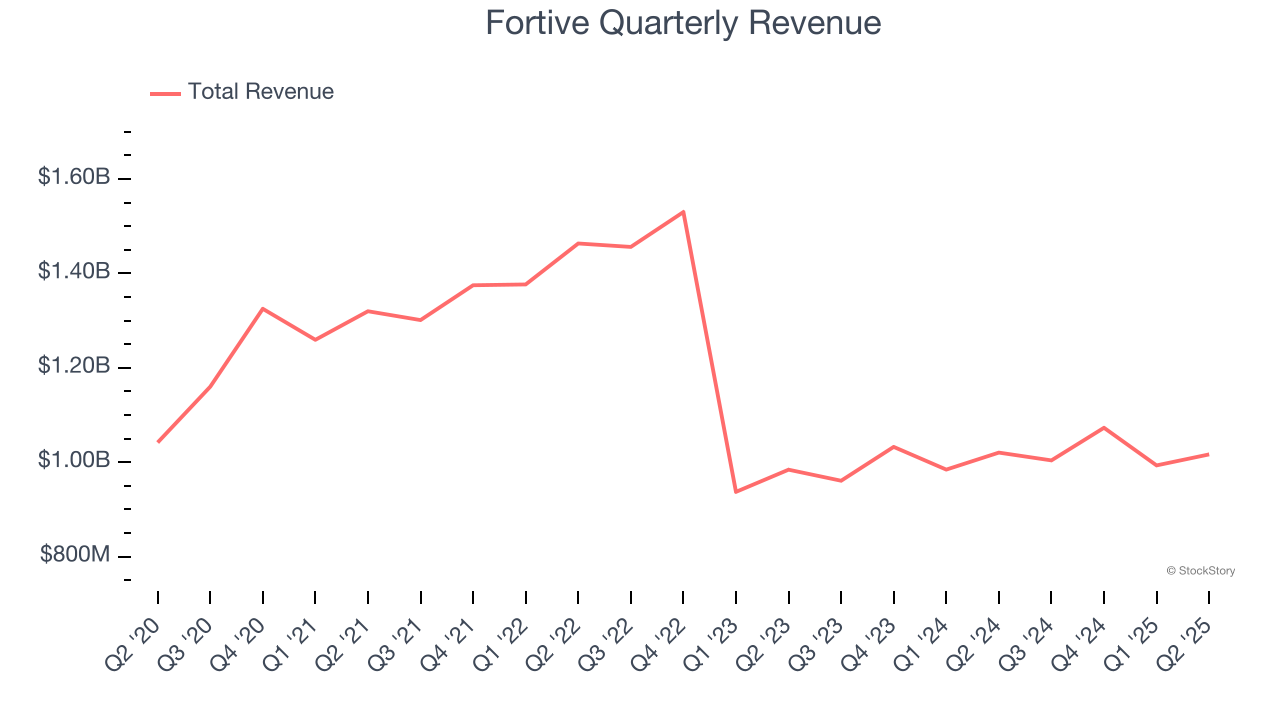
Long-term growth is the most important, but within industrials, a half-decade historical view may miss new industry trends or demand cycles. Fortive’s recent performance shows its demand remained suppressed as its revenue has declined by 8.7% annually over the last two years. 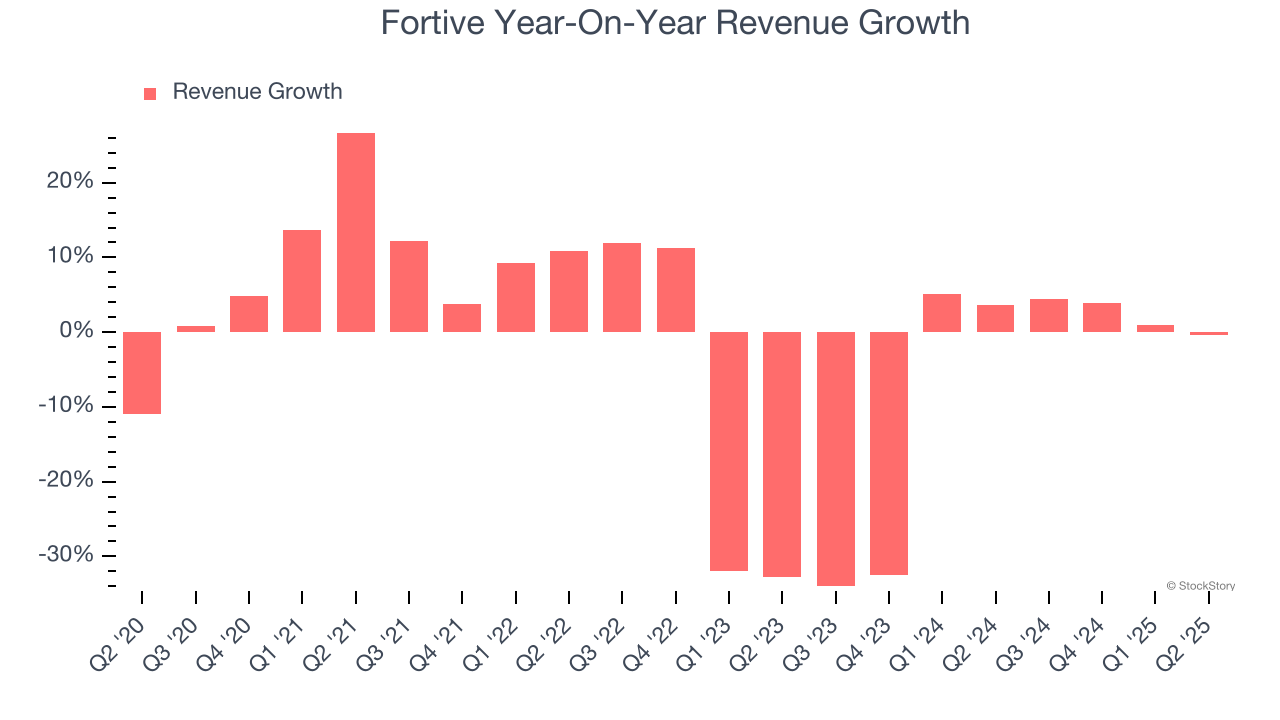
This quarter, Fortive’s $1.02 billion of revenue was flat year on year and in line with Wall Street’s estimates.
Looking ahead, sell-side analysts expect revenue to grow 2.9% over the next 12 months. Although this projection implies its newer products and services will spur better top-line performance, it is still below average for the sector.
Today’s young investors won’t have read the timeless lessons in Gorilla Game: Picking Winners In High Technology because it was written more than 20 years ago when Microsoft and Apple were first establishing their supremacy. But if we apply the same principles, then enterprise software stocks leveraging their own generative AI capabilities may well be the Gorillas of the future. So, in that spirit, we are excited to present our Special Free Report on a profitable, fast-growing enterprise software stock that is already riding the automation wave and looking to catch the generative AI next.
Operating Margin
Fortive has been a well-oiled machine over the last five years. It demonstrated elite profitability for an industrials business, boasting an average operating margin of 15.9%. This result isn’t surprising as its high gross margin gives it a favorable starting point.
Analyzing the trend in its profitability, Fortive’s operating margin rose by 3.2 percentage points over the last five years, showing its efficiency has improved.
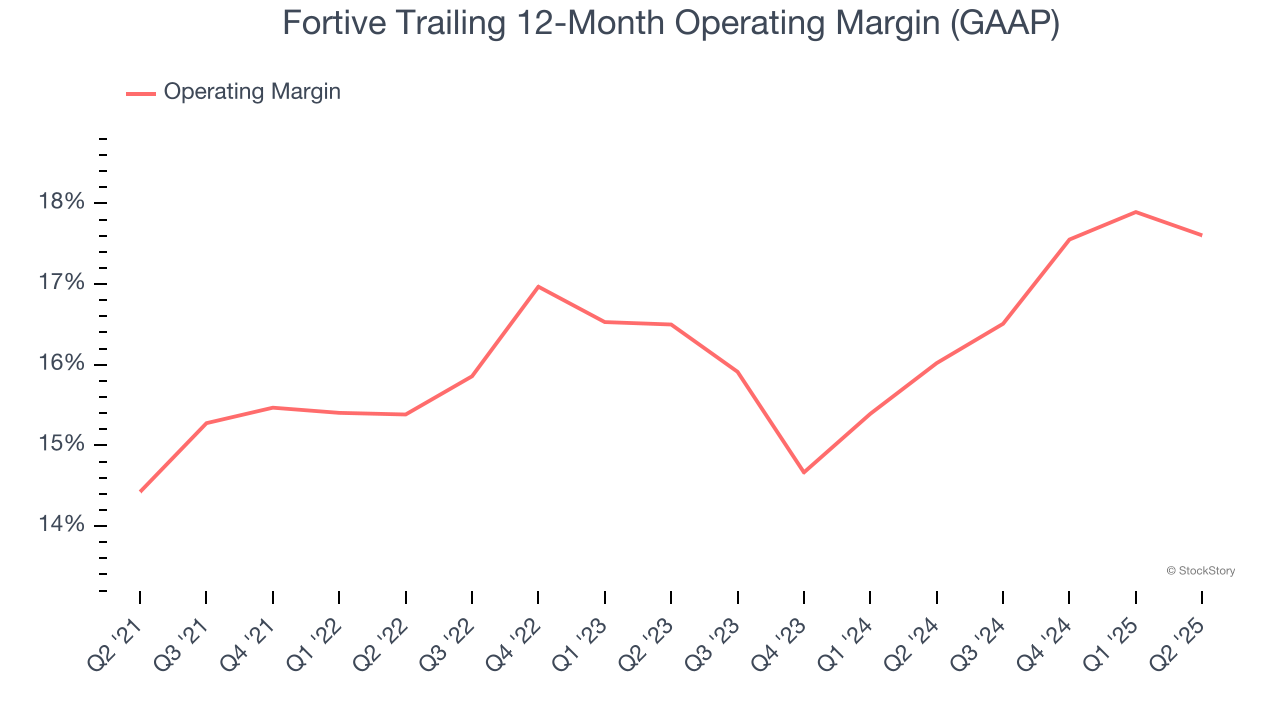
This quarter, Fortive generated an operating margin profit margin of 16.7%, down 1.2 percentage points year on year. Since Fortive’s operating margin decreased more than its gross margin, we can assume it was less efficient because expenses such as marketing, R&D, and administrative overhead increased.
Earnings Per Share
Revenue trends explain a company’s historical growth, but the long-term change in earnings per share (EPS) points to the profitability of that growth – for example, a company could inflate its sales through excessive spending on advertising and promotions.
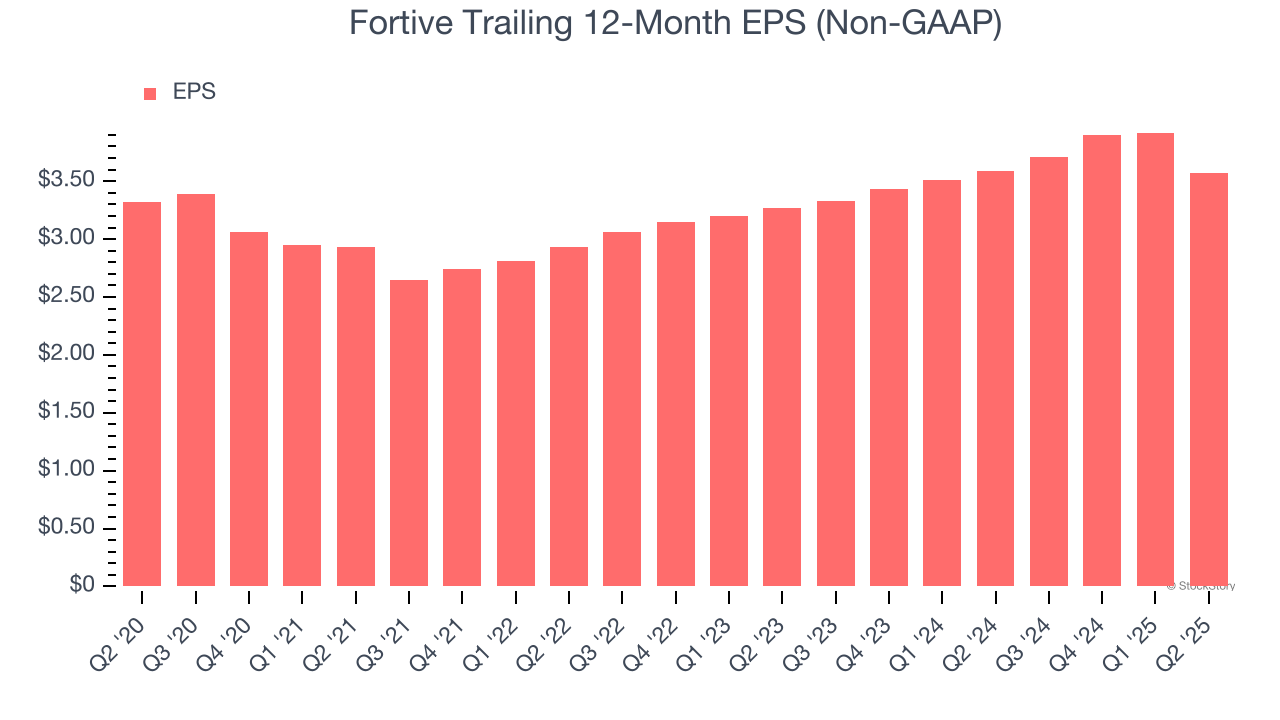
Fortive’s EPS grew at a weak 1.5% compounded annual growth rate over the last five years. On the bright side, this performance was better than its 2.2% annualized revenue declines and tells us management adapted its cost structure in response to a challenging demand environment.
We can take a deeper look into Fortive’s earnings to better understand the drivers of its performance. As we mentioned earlier, Fortive’s operating margin declined this quarter but expanded by 3.2 percentage points over the last five years. This was the most relevant factor (aside from the revenue impact) behind its higher earnings; interest expenses and taxes can also affect EPS but don’t tell us as much about a company’s fundamentals.
Like with revenue, we analyze EPS over a more recent period because it can provide insight into an emerging theme or development for the business.
For Fortive, its two-year annual EPS growth of 4.5% was higher than its five-year trend. Accelerating earnings growth is almost always an encouraging data point.
In Q2, Fortive reported EPS at $0.58, down from $0.93 in the same quarter last year. This print missed analysts’ estimates. Over the next 12 months, Wall Street expects Fortive’s full-year EPS of $3.57 to shrink by 24.4%.
Key Takeaways from Fortive’s Q2 Results
It was good to see Fortive provide full-year EPS guidance that slightly beat analysts’ expectations. We were also happy its revenue was in line with Wall Street’s estimates. On the other hand, its EPS missed. Overall, this was a mixed quarter. The stock traded up 2.2% to $52 immediately following the results.
Should you buy the stock or not? When making that decision, it’s important to consider its valuation, business qualities, as well as what has happened in the latest quarter. We cover that in our actionable full research report which you can read here, it’s free.