


NEW YORK, July 27, 2015 /PRNewswire/ -- Brixmor Property Group Inc. (NYSE: BRX) ("Brixmor" or the "Company") announced today its results of operations for the second quarter ended June 30, 2015.

Second Quarter 2015 Operating Results
Three Months Ended | |||||||
6/30/2015 | 6/30/2014 | Change | |||||
Percent leased | 92.5% | 92.5% | - | ||||
Percent leased: anchors (> 10K SF) | 96.2% | 97.0% | (80) basis points | ||||
Percent leased: small shop (< 10K SF) | 83.6% | 82.1% | +150 basis points | ||||
New lease average annualized base rent ("ABR") / SF | $15.89 | $12.52 | +26.9% | ||||
Total new and renewal lease ABR / SF | $12.49 | $11.53 | +8.3% | ||||
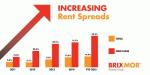
Total rent spread (cash) | 16.1% | 11.2% | +490 basis points | ||||
Portfolio ABR / SF | $12.31 | $12.04 | +2.2% | ||||
"With new lease ABR per square foot of $15.89, 29% above in-place rents, and rent spreads accelerating the past twelve months to reach over 16% this quarter, our investment proposition has never been more apparent. Our same property net operating income ("same property NOI") growth of 3.6% underscores our outstanding internal growth and the significant mark-to-market opportunity in our portfolio. Click to Tweet: When combined with our Raising the Bar efforts, we are driving healthy operating fundamentals, with small shop occupancy gaining 150 basis points year-over-year and 40 basis points sequentially," stated Michael Carroll, Chief Executive Officer.
Dividend
- The Company's Board of Directors declared a quarterly cash dividend of $0.225 per common share (equivalent to $0.90 per annum) for the third quarter of 2015.
- The dividend is payable on October 15, 2015 to stockholders of record on October 5, 2015, representing an ex-dividend date of October 1, 2015.
Financial Highlights
FFO
- For the three months ended June 30, 2015 and June 30, 2014, FFO attributable to stockholders and non-controlling interests convertible into common stock was $149.1 million, or $0.49 per diluted share and $140.1 million, or $0.46 per diluted share, respectively.
- For the six months ended June 30, 2015 and June 30, 2014 (on an actual and pro forma basis), FFO attributable to stockholders and non-controlling interests convertible into common stock was $288.2 million, or $0.95 per diluted share and $272.7 million, or $0.90 per diluted share, respectively.
- For the six months ended June 30, 2015, results include the impact of approximately $10.6 million, or ($0.03) per diluted share, of a $9.9 million non-cash, non-recurring charge related to compensation programs prior to the Company's initial public offering that were based on the selling stockholders returns and $0.7 million of costs related to the prepayment of debt and property acquisition related expenses. For the six months ended June 30, 2014 (on a pro forma basis), results include the impact of costs related to the prepayment of debt of $3.0 million, or ($0.01) per diluted share.
Net Income
- For the three months ended June 30, 2015 and June 30, 2014, net income attributable to common stockholders was $54.1 million, or $0.18 per diluted share and $23.5 million, or $0.10 per diluted share, respectively.
- For the six months ended June 30, 2015 and June 30, 2014 (on an actual and pro forma basis), net income attributable to common stockholders was $84.5 million, or $0.28 per diluted share and $38.9 million, or $0.17 per diluted share, respectively.
Same Property NOI
- Same property NOI for the three months ended June 30, 2015 increased 3.6% from the comparable 2014 period due to growth in rental income driven by strong leasing spreads as the Company continues to harvest the below-market leases inherent in its portfolio, as well as from operating expense savings.
- Same property NOI for the first six months of 2015 increased 3.5% from the comparable 2014 period.
Portfolio and Investment Activity
Anchor Space Repositioning / Redevelopment / Outparcel Development
- During the second quarter, the Company completed seven anchor space repositioning projects and added eight anchor space repositioning projects and three outparcel development projects to its pipeline.
- At June 30, 2015, the anchor space repositioning / outparcel development pipeline was comprised of 36 projects, the aggregate cost of which is expected to be approximately $93.6 million.
Acquisitions
In June 2015, the Company acquired three assets for an aggregate of $59.2 million totaling approximately 383,000 square feet of GLA. These acquisitions are summarized below:
- On June 10, 2015, the Company acquired a 96,000 square foot Hobby Lobby building at Bardin Place Center, a shopping center owned by the Company and currently being re-anchored with WinCo Foods, in the Dallas, Texas market for approximately $9.3 million. The Company intends to further drive value at the center by downsizing the Hobby Lobby and remerchandising the remaining underutilized space;
- On June 30, 2015, the Company acquired Webster Square Shopping Center, an 183,000 square foot shopping center in the Boston, Massachusetts market and anchored by Star Market (Albertsons) and Marshalls for approximately $32.0 million. The Company intends to add retail densification to the asset by developing new outparcels, while also marking-to-market below market rents within the property lease structure; and
- On June 30, 2015, the Company acquired Larchmont Centre, a 104,000 square foot shopping center in the Philadelphia, Pennsylvania market and anchored by ShopRite for approximately $18.0 million, including approximately $7.0 million of assumed mortgage indebtedness. The Company intends to execute an expansion of the ShopRite grocer and drive occupancy with small shop leasing.

Photo - http://photos.prnewswire.com/prnh/20150727/245801

Photo - http://photos.prnewswire.com/prnh/20150727/245802
Dispositions
During the second quarter of 2015, the Company generated approximately $32.3 million of proceeds through the portfolio sale of three properties and two outparcels. Properties sold include:
- A 63,000 square foot asset in Davenport, Iowa;
- A 104,000 square foot asset in Portland, Maine;
- An 115,000 square foot asset in Brenham, Texas; and
- Two outparcels in Cleveland, Ohio.
During the first six months of 2015, the Company generated an aggregate of approximately $42.6 million of proceeds through asset sales consistent with the Company's strategy of disposing of assets when growth has been maximized.
Capital Structure
- As part of the Company's ongoing program to reduce secured debt and increase financial flexibility, Brixmor repaid $330 million of secured borrowings during the quarter.
- At June 30, 2015, the Company had increased its unencumbered asset pool to 56% of its properties from 40% at December 31, 2013.
Corporate Governance
- On June 8, 2015, Gabrielle Sulzberger, a General Partner of Rustic Canyon/Fontis Partners, L.P., a private equity fund which she co-founded in 2005, and a director of Whole Foods Market, Inc., was appointed as an independent director to the Company's board of directors. Ms. Sulzberger will also serve on the audit committee of the Board. She brings over ten years of retail experience in the grocery and diversified retail industries, complementing Brixmor's position as the nation's largest owner of wholly owned grocery-anchored community and neighborhood shopping centers.
- In addition, consistent with the Company's and Board's best-in-class governance practices, effective July 27, 2015, A.J. Agarwal, a Blackstone designee, has resigned from the Company's board of directors. As a result of this resignation, the Company's Board has been reduced to nine directors, with only three Blackstone designees remaining on the Board. The Company's Board is now majority independent and fully compliant with NYSE listing standards for Board constituency, earlier than the time frame required under NYSE transition rules for former controlled companies.
Guidance
- The Company is affirming its previously provided expectations for 2015 earnings and portfolio metrics.
Connect With Brixmor
- For additional information, please visit www.brixmor.com;
- Follow Brixmor on Twitter at www.twitter.com/Brixmor
- Find Brixmor on LinkedIn at www.linkedin.com/company/brixmor.
Pro Forma Results
Pro forma results reflect the distribution of 36 properties to certain investment funds affiliated with the Blackstone Group L.P. during the first quarter of 2014. The pro forma adjustments assume that the distribution of the properties was completed as of January 1, 2014 for the purpose of the unaudited pro forma consolidated statements of operations. A reconciliation of results of operations to actual results of operations is presented in the attached table.
Conference Call and Supplemental Information
The Company will host a teleconference on Tuesday, July 28, 2015 at 10:00 AM ET. To participate, please dial 888.317.6003 (domestic) or 412.317.6061 (international) at least ten minutes prior to the scheduled start of the call (Passcode: 9653366). The teleconference can also be accessed via a live webcast at www.brixmor.com in the Investors section. A replay of the teleconference will be available through midnight ET on August 12, 2015 by dialing 877.344.7529 (domestic) or 412.317.0088 (international) (Passcode: 10065720) or via the web through July 28, 2016 at www.brixmor.com in the Investors section.
The Company's Supplemental Disclosure will be posted at www.brixmor.com in the Investors section. These materials are also available to all interested parties upon request to the Company at investorrelations@brixmor.com or 800.468.7526.
Non-GAAP Disclosures
FFO
FFO is a supplemental non-GAAP financial measure utilized to evaluate the operating performance of real estate companies. The National Association of Real Estate Investment Trusts ("NAREIT") defines FFO as net income (loss) in accordance with GAAP excluding (i) gain (loss) on disposition of operating properties, and (ii) extraordinary items, plus (iii) depreciation and amortization of operating properties, (iv) impairment of operating properties and real estate equity investments, and (v) after adjustments for joint ventures calculated to reflect funds from operations on the same basis. FFO attributable to stockholders and non-controlling interests convertible into common stock is FFO as further adjusted to exclude net income (loss) attributable to non-controlling interests not convertible into common stock. The Company believes FFO attributable to stockholders and non-controlling interests convertible into common stock is a meaningful supplemental measure that is more reflective of its operating performance by excluding FFO attributable to non-controlling interests not convertible into common stock.
The Company presents FFO and FFO attributable to stockholders and non-controlling interests convertible into common stock as it considers them important supplemental measures of its operating performance and the Company believes they are frequently used by securities analysts, investors and other interested parties in the evaluation of REITs. FFO and FFO attributable to stockholders and non-controlling interests convertible into common stock should not be considered as alternatives to net income (determined in accordance with GAAP) as indicators of financial performance and are not alternatives to cash flow from operating activities (determined in accordance with GAAP) as measures of liquidity. Non-GAAP financial measures have limitations as they do not include all items of income and expense that affect operations and, accordingly, should always be considered as supplemental to financial results presented in accordance with GAAP. Computation of FFO and FFO attributable to stockholders and non-controlling interests convertible into common stock may differ in certain respects from the methodology utilized by other REITs and, therefore, may not be comparable to similarly titled measures presented by such other REITs. Investors are cautioned that items excluded from FFO and FFO attributable to stockholders and non-controlling interests convertible into common stock are significant components in understanding and addressing financial performance. A reconciliation of FFO and FFO attributable to non-controlling interests not convertible into common stock to Net income is presented in the attached table.
Same Property NOI
Same property NOI is calculated (using properties owned as of the end of both reporting periods and for the entirety of both periods excluding properties classified as discontinued operations), as rental income (minimum rent, percentage rents, tenant recoveries and other property income) less rental operating expenses (property operating expenses, real estate taxes and bad debt expense) of the properties owned by Brixmor. Same property NOI excludes corporate level income (including transaction and other fees), lease termination income, straight-line rent and amortization of above-/below-market leases of the same property pool from the prior year reporting period to the current year reporting period.
Same property NOI is a supplemental, non-GAAP financial measure utilized to evaluate the operating performance of real estate companies and the Company believes it is frequently used by securities analysts, investors and other interested parties in understanding business and operating results regarding the underlying economics of Brixmor's business operations. It includes only the net operating income of properties owned for the full period presented, which eliminates disparities in net income due to the acquisition or disposition of properties during the period presented, and therefore, provides a more consistent metric for comparing the performance of properties. Management uses same property NOI to review operating results for comparative purposes with respect to previous periods or forecasts, and also to evaluate future prospects. Same property NOI is not intended to be a performance measure that should be regarded as an alternative to, or more meaningful than, net income (determined in accordance with GAAP) or other GAAP financial measures. Non-GAAP financial measures have limitations as they do not include all items of income and expense that affect operations, and accordingly, should always be considered as supplemental to financial results presented in accordance with GAAP. Computation of same property NOI may differ in certain respects from the methodology utilized by other REITs and, therefore, may not be comparable to such other REITs. See page 12 of the Company's Supplemental Disclosure for a reconciliation of Same property NOI to Net income attributable to common stockholders.
About Brixmor Property Group
Brixmor owns and operates the nation's largest wholly owned portfolio of grocery-anchored community and neighborhood shopping centers, with 519 properties aggregating approximately 87 million square feet of gross leasable area located primarily across the top 50 U.S. metro markets. Brixmor leverages its national footprint, local market knowledge and operational expertise to support the growth of its retail tenants. The Company is focused on maximizing the value of its portfolio through its ongoing "Raising the Bar" program which involves strategic leasing and anchor space repositioning / redevelopment initiatives. Headquartered in New York City, the Company is the largest landlord to The TJX Companies and The Kroger Company.
Safe Harbor Language
This press release may contain forward-looking statements within the meaning of Section 27A of the Securities Act of 1933 and Section 21E of the Securities Exchange Act of 1934. These statements include, but are not limited to, statements related to the Company's expectations regarding the performance of its business, its financial results, its liquidity and capital resources and other non-historical statements. You can identify these forward-looking statements by the use of words such as "outlook," "believes," "expects," "potential," "continues," "may," "will," "should," "seeks," "approximately," "projects," "predicts," "intends," "plans," "estimates," "anticipates" or the negative version of these words or other comparable words. Such forward-looking statements are subject to various risks and uncertainties, including those described under the section entitled "Risk Factors" in the Company's Annual Report on Form 10-K for the year ended December 31, 2014, as such factors may be updated from time to time in our periodic filings with the SEC, which are accessible on the SEC's website at www.sec.gov. Accordingly, there are or will be important factors that could cause actual outcomes or results to differ materially from those indicated in these statements. These factors should not be construed as exhaustive and should be read in conjunction with the other cautionary statements that are included in this release and in the Company's filings with the SEC. The Company undertakes no obligation to publicly update or review any forward-looking statement, whether as a result of new information, future developments or otherwise, except as required by law.
CONSOLIDATED BALANCE SHEETS | |||||||
Unaudited, dollars in thousands, except share information | |||||||
6/30/15 | 12/31/14 | ||||||
Assets | |||||||
Real estate | |||||||
Land | $ 2,008,601 | $ 2,000,415 | |||||
Buildings and improvements | 8,870,376 | 8,801,834 | |||||
10,878,977 | 10,802,249 | ||||||
Accumulated depreciation and amortization | (1,711,841) | (1,549,234) | |||||
Real estate, net | 9,167,136 | 9,253,015 | |||||
Investments in and advances to unconsolidated joint ventures | 5,039 | 5,072 | |||||
Cash and cash equivalents | 42,735 | 60,595 | |||||
Restricted cash | 61,163 | 53,164 | |||||
Marketable securities | 20,034 | 20,315 | |||||
Receivables, net of allowance for doubtful accounts of $13,435 and $14,070 | 169,359 | 182,424 | |||||
Deferred charges and prepaid expenses, net | 97,923 | 94,269 | |||||
Other assets | 14,115 | 13,059 | |||||
Total assets | $ 9,577,504 | $ 9,681,913 | |||||
Liabilities | |||||||
Debt obligations, net | $ 5,998,651 | $ 6,022,508 | |||||
Accounts payable, accrued expenses and other liabilities | 636,610 | 679,102 | |||||
Total liabilities | 6,635,261 | 6,701,610 | |||||
Equity | |||||||
Common stock, $0.01 par value; authorized 3,000,000,000 shares; | |||||||
298,488,602 and 296,552,142 shares outstanding | 2,985 | 2,966 | |||||
Additional paid in capital | 3,257,439 | 3,223,941 | |||||
Accumulated other comprehensive loss | (6,136) | (4,435) | |||||
Distributions and accumulated losses | (369,194) | (318,762) | |||||
Total stockholders' equity | 2,885,094 | 2,903,710 | |||||
Non-controlling interests | 57,149 | 76,593 | |||||
Total equity | 2,942,243 | 2,980,303 | |||||
Total liabilities and equity | $ 9,577,504 | $ 9,681,913 | |||||
CONSOLIDATED STATEMENTS OF OPERATIONS | ||||||||||||||
Unaudited, dollars in thousands, except per share amounts | ||||||||||||||
Actual Results | Actual Results | Pro Forma | Actual Results | |||||||||||
Three Months Ended | Six Months Ended | Six Months | ||||||||||||
6/30/15 | 6/30/14 | 6/30/15 | 6/30/14 | Ended 6/30/14 | ||||||||||
Revenues | ||||||||||||||
Rental income | $ 244,030 | $ 239,987 | $ 487,600 | $ 477,154 | $ 477,154 | |||||||||
Expense reimbursements | 65,512 | 65,655 | 135,266 | 134,251 | 134,251 | |||||||||
Other revenues | 2,569 | 2,307 | 4,538 | 4,120 | 4,120 | |||||||||
Total revenues | 312,111 | 307,949 | 627,404 | 615,525 | 615,525 | |||||||||
Operating expenses | ||||||||||||||
Operating costs | 30,667 | 31,889 | 65,827 | 66,764 | 66,764 | |||||||||
Real estate taxes | 43,974 | 43,812 | 88,163 | 88,246 | 88,246 | |||||||||
Depreciation and amortization | 104,441 | 109,600 | 212,985 | 222,820 | 222,820 | |||||||||
Provision for doubtful accounts | 2,525 | 2,980 | 5,020 | 5,846 | 5,846 | |||||||||
Impairment of real estate assets | - | - | 807 | - | - | |||||||||
General and administrative | 20,285 | 19,939 | 51,000 | 39,597 | 39,597 | |||||||||
Total operating expenses | 201,892 | 208,220 | 423,802 | 423,273 | 423,273 | |||||||||
Other income (expense) | ||||||||||||||
Dividends and interest | 90 | 159 | 184 | 267 | 267 | |||||||||
Interest expense | (62,158) | (65,953) | (124,722) | (133,919) | (133,919) | |||||||||
Gain on sale of real estate assets | 9,224 | - | 9,224 | 378 | 378 | |||||||||
Gain (loss) on extinguishment of debt, net | 493 | (757) | 785 | (3,033) | (3,033) | |||||||||
Other | (2,811) | (1,969) | (2,995) | (4,130) | (4,130) | |||||||||
Total other expense | (55,162) | (68,520) | (117,524) | (140,437) | (140,437) | |||||||||
Income before equity in income of unconsolidated joint ventures | 55,057 | 31,209 | 86,078 | 51,815 | 51,815 | |||||||||
Equity in income of unconsolidated joint ventures | 110 | 71 | 225 | 204 | 136 | |||||||||
Gain on disposition of investments in unconsolidated joint ventures | - | - | - | - | 1,820 | |||||||||
Income from continuing operations | 55,167 | 31,280 | 86,303 | 52,019 | 53,771 | |||||||||
Discontinued operations | ||||||||||||||
Income from discontinued operations | - | 18 | - | 54 | 4,841 | |||||||||
Gain on disposition of operating properties | - | - | - | - | 14,426 | |||||||||
Income from discontinued operations | - | 18 | - | 54 | 19,267 | |||||||||
Net income | 55,167 | 31,298 | 86,303 | 52,073 | 73,038 | |||||||||
Net income attributable to non-controlling interests | (1,055) | (7,825) | (1,768) | (13,172) | (34,164) | |||||||||
Net income attributable to common stockholders | $ 54,112 | $ 23,473 | $ 84,535 | $ 38,901 | $ 38,874 | |||||||||
Per common share: | ||||||||||||||
Income from continuing operations: | ||||||||||||||
Basic | $ 0.18 | $ 0.10 | $ 0.28 | $ 0.17 | $ 0.17 | |||||||||
Diluted | $ 0.18 | $ 0.10 | $ 0.28 | $ 0.17 | $ 0.17 | |||||||||
Net income attributable to common stockholders: | ||||||||||||||
Basic | $ 0.18 | $ 0.10 | $ 0.28 | $ 0.17 | $ 0.17 | |||||||||
Diluted | $ 0.18 | $ 0.10 | $ 0.28 | $ 0.17 | $ 0.17 | |||||||||
Weighted average shares: | ||||||||||||||
Basic | 298,464 | 228,978 | 297,332 | 228,547 | 228,547 | |||||||||
Diluted | 298,994 | 230,469 | 304,719 | 229,907 | 229,907 | |||||||||
RECONCILIATION OF NET INCOME TO FFO | ||||||||||||||
Unaudited, dollars in thousands, except per share amounts | ||||||||||||||
Actual Results | Actual Results | Pro Forma | Actual Results | |||||||||||
Three Months Ended | Six Months Ended | Six Months | ||||||||||||
6/30/15 | 6/30/14 | 6/30/15 | 6/30/14 | Ended 6/30/14 | ||||||||||
Net income | $ 55,167 | $ 31,298 | $ 86,303 | $ 52,073 | $ 73,038 | |||||||||
Gain on disposition of operating properties | (9,224) | - | (9,224) | (378) | (14,804) | |||||||||
Gain on disposition of unconsolidated joint ventures | - | - | - | - | (1,820) | |||||||||
Depreciation and amortization- real estate related- continuing | 103,087 | 109,007 | 210,277 | 221,544 | 221,544 | |||||||||
Depreciation and amortization- real estate related- discontinued | - | 66 | - | 114 | 545 | |||||||||
Depreciation and amortization- real estate related- unconsolidated | 21 | 21 | 43 | 41 | 123 | |||||||||
Impairment of real estate assets | - | - | 807 | - | - | |||||||||
FFO | 149,051 | 140,392 | 288,206 | 273,394 | 278,626 | |||||||||
Adjustments attributable to non-controlling interests not convertible | - | (322) | - | (646) | (5,878) | |||||||||
FFO attributable to stockholders and non-controlling interests convertible | $ 149,051 | $ 140,070 | $ 288,206 | $ 272,748 | $ 272,748 | |||||||||
FFO per share/OP Unit - diluted | $ 0.49 | $ 0.46 | $ 0.95 | $ 0.90 | $ 0.90 | |||||||||
Weighted average shares/OP Units outstanding - basic and diluted (1) | 304,826 | 304,390 | 304,730 | 304,253 | 304,253 | |||||||||
Items that impact FFO comparability | ||||||||||||||
Non-cash, non-recurring charge related to compensation programs | $ - | $ - | $ (9,875) | $ - | $ - | |||||||||
Property acquisition expenses | (1,487) | - | (1,487) | - | - | |||||||||
Gain (loss) on extinguishment of debt, net | 493 | (757) | 785 | (3,033) | 3,041 | |||||||||
Total items that impact FFO comparability | $ (994) | $ (757) | $ (10,577) | $ (3,033) | $ 3,041 | |||||||||
Items that impact FFO comparability, net per share | $ (0.00) | $ (0.00) | $ (0.03) | $ (0.01) | $ 0.01 | |||||||||
Dividends declared per share/OP Unit | $ 0.225 | $ 0.200 | $ 0.450 | $ 0.400 | $ 0.400 | |||||||||
Shares/OP Unit dividends declared | $ 68,468 | $ 60,846 | $ 136,934 | $ 121,692 | $ 121,692 | |||||||||
Share/OP Unit dividend payout ratio (as % of FFO) | 45.9% | 43.4% | 47.5% | 44.6% | 44.6% | |||||||||
(1) Basic and diluted shares/OP Units outstanding reflects an assumed conversion of certain BPG Sub shares and OP Units to common stock of the Company and the vesting of certain restricted stock awards. | ||||||||||||||
RECONCILIATION OF GAAP STATEMENTS OF OPERATIONS TO PRO | ||||||||||
FORMA STATEMENTS OF OPERATIONS | ||||||||||
Unaudited, dollars in thousands, except per share amounts | ||||||||||
Six Months Ended 6/30/14 | ||||||||||
Actual Results | Adjustments (1) | Pro Forma | ||||||||
Revenues | ||||||||||
Rental income | $ 477,154 | $ - | $ 477,154 | |||||||
Expense reimbursements | 134,251 | - | 134,251 | |||||||
Other revenues | 4,120 | - | 4,120 | |||||||
Total revenues | 615,525 | - | 615,525 | |||||||
Operating expenses | ||||||||||
Operating costs | 66,764 | - | 66,764 | |||||||
Real estate taxes | 88,246 | - | 88,246 | |||||||
Depreciation and amortization | 222,820 | - | 222,820 | |||||||
Provision for doubtful accounts | 5,846 | - | 5,846 | |||||||
General and administrative | 39,597 | - | 39,597 | |||||||
Total operating expenses | 423,273 | - | 423,273 | |||||||
Other income (expense) | ||||||||||
Dividends and interest | 267 | - | 267 | |||||||
Interest expense | (133,919) | - | (133,919) | |||||||
Gain on sale of real estate assets | 378 | - | 378 | |||||||
Loss on extinguishment of debt, net | (3,033) | - | (3,033) | |||||||
Other | (4,130) | - | (4,130) | |||||||
Total other expense | (140,437) | - | (140,437) | |||||||
Income before equity in income of unconsolidated joint ventures | 51,815 | - | 51,815 | |||||||
Equity in income of unconsolidated joint ventures | 136 | 68 | 204 | |||||||
Gain on disposition of investments in unconsolidated joint ventures | 1,820 | (1,820) | - | |||||||
Income from continuing operations | 53,771 | (1,752) | 52,019 | |||||||
Discontinued operations | ||||||||||
Income from discontinued operations | 4,841 | (4,787) | 54 | |||||||
Gain on disposition of operating properties | 14,426 | (14,426) | - | |||||||
Income from discontinued operations | 19,267 | (19,213) | 54 | |||||||
Net income | 73,038 | (20,965) | 52,073 | |||||||
Net income attributable to non-controlling interests | (34,164) | 20,992 | (13,172) | |||||||
Net income attributable to common stockholders | $ 38,874 | $ 27 | $ 38,901 | |||||||
Per common share: | ||||||||||
Income from continuing operations: | ||||||||||
Basic | $ 0.17 | $ - | $ 0.17 | |||||||
Diluted | $ 0.17 | $ - | $ 0.17 | |||||||
Net income attributable to common stockholders: | ||||||||||
Basic | $ 0.17 | $ - | $ 0.17 | |||||||
Diluted | $ 0.17 | $ - | $ 0.17 | |||||||
Weighted average number of vested common shares: | ||||||||||
Basic | 228,547 | - | 228,547 | |||||||
Diluted | 229,907 | - | 229,907 | |||||||
(1) Reflects the impact associated with the distribution of 36 of the Excluded Properties during the first quarter of 2014. The pro forma adjustments assume that the distribution of the properties was completed as of January 1, 2014. | ||||||||||

Photo - http://photos.prnewswire.com/prnh/20150727/245800-INFO
Logo - http://photos.prnewswire.com/prnh/20110928/NY76014LOGO
To view the original version on PR Newswire, visit:http://www.prnewswire.com/news-releases/brixmor-property-group-reports-second-quarter-2015-results-300119087.html
SOURCE Brixmor Property Group Inc.
