Thanks to another around of bubble fears impacting artificial intelligence, even cybersecurity entities — such as Palo Alto Networks (PANW) — have felt the heat. In a way, the downturn affecting PANW stock represents a cruel irony. Whereas the main narrative focuses on excessive capital expenditure toward AI hype, in Palo Alto’s case, machine intelligence’s proven prowess has become the lynchpin.
Essentially, the rapid adoption of enterprise AI is fueling an unprecedented surge in cloud security risks; namely, Palo Alto recently presented a report that digital intelligence itself is driving a massive expansion of the cloud attack surface. One of the main problems is that generative AI can generate insecure code faster than security teams can review it, leading to widespread vulnerabilities.
Put another way, for most investments, the concern is that capital inflows toward machine intelligence have become excessive and divorced from the actual fundamentals. In contrast, in the cybersecurity realm, AI is too effective, creating headwinds that cannot be adequately addressed under current bandwidth limitations.
Given this context, it’s not too surprising that PANW stock hasn’t performed that well this year. Since the January opener, the security has only gained less than 1%. What’s also problematic is the Barchart Technical Opinion indicator, which rates PANW as a 40% Sell — not exactly a ringing endorsement.
Still, it might be premature to give up on Palo Alto. First, if we look at options flow, we’ll note that big block transactions this month have mostly been bullish on a cumulative basis. That’s not say that there weren’t bearish transactions because a few did materialize. Overall, though, net trade sentiment has been positive.
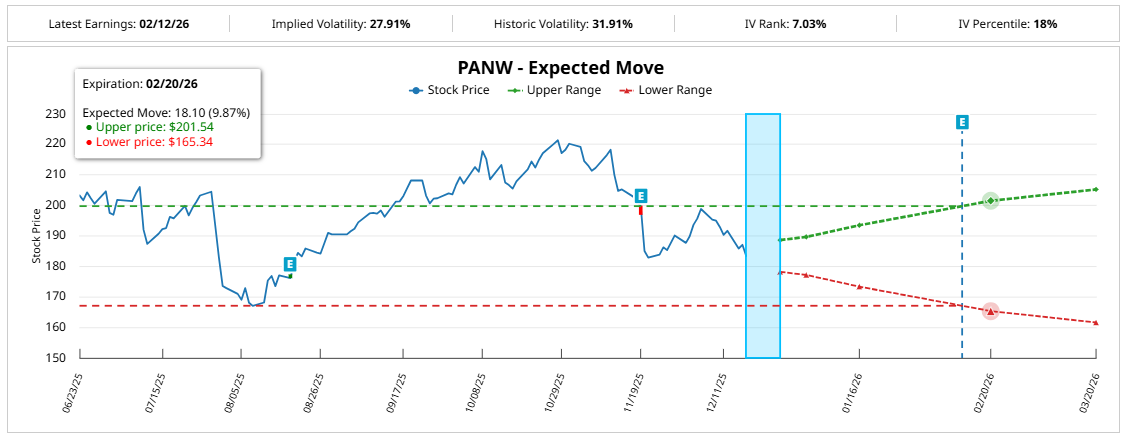
What’s also intriguing is Barchart’s Expected Move calculator. Based on the latest implied volatility (IV) data — which is a residual value stemming from actual option flows — the price range is forecasted to land between $165.35 and $201.54 for the Feb. 20, 2026 expiration date.
While this is a valuable distribution, I want to have a better idea of where PANW stock will go — and more importantly, where it stops going.
Trading PANW Stock Based Purely on Risk Geometry
For newcomers to options, the derivatives market can seem incredibly intimidating. However, once you start opening your eyes to alternative methodologies and mechanisms, options trading will start gliding like a well-oiled machine. It’s not that traditional methodologies are difficult — rather, there are different ways to address dynamic problems.
Primarily, much of options literature is focused on risk dispersion, which is based on parametric distributions utilizing the Black-Scholes formula. Its main strength is universal applicability. However, where I come in is to introduce an accretive detail. I’m proposing a model that identifies risk geometry.
Mechanically, risk geometry can only materialize through fixed-time distributional analysis. Specifically, we would take the single strand of continuous price history of PANW stock and split it into hundreds (if not thousands) of rolling trials or sequences.
Why? The philosophy is that if we took, for example, one 10-week cycle, the return during this period won’t tell us much about the returns of other cycles in the dataset. However, if we ran hundreds of these 10-week cycles in a fixed-time distribution, the most frequent, prominent behaviors would lead to bulges in the distribution.
That bulge is probability density — the likelihood that the stock will land on a particular price point across the fixed time horizon.
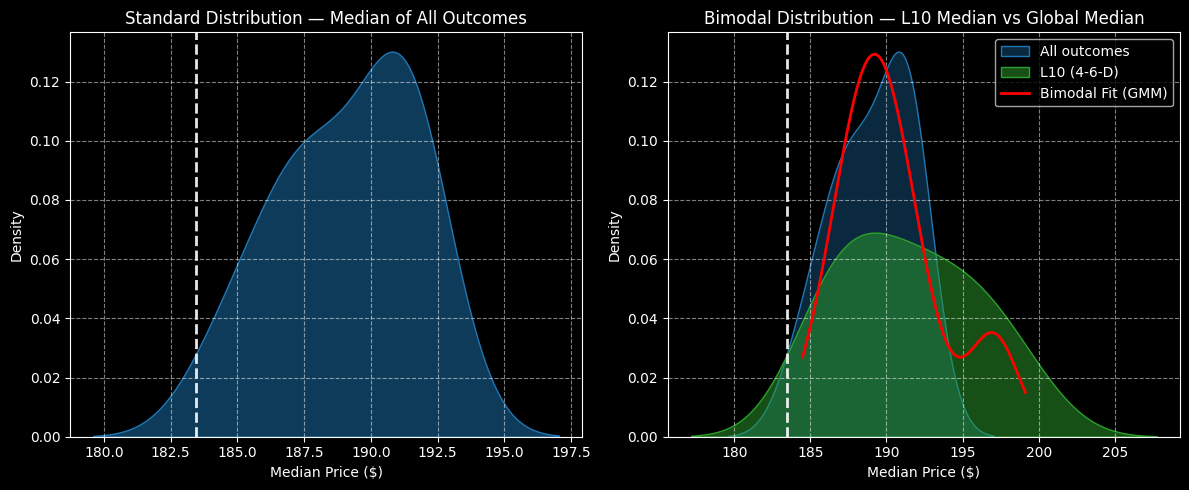
By understanding the role of probability density in the context of risk geometry, we can make much smarter decisions. Essentially, we would have a good idea of two valuable takeaways. First, we would know where PANW stock would coalesce over a given time period. Second, we would know where probability decay accelerates; that is, where probability density drops sharply.
In a vertical spread, our job would be simple: buy the reality, sell the fantasy.
When it comes to PANW stock, the current quant signal is the 4-6-D sequence; that is, in the past 10 weeks, only four of the candlesticks were up weeks. Under this setup, we can expect probability density over the next 10 weeks to rise through $190. From $190 to $195, density declines modestly. Between $195 and beyond, density drops exponentially.
We now have Palo Alto’s risk geometry — and that’s all we need to make an informed trading decision.
Following the Numbers
From here on out, it’s just a matter of following the numbers. Again, we know that PANW stock will likely rise through $190 over the next 10 weeks but will struggle to maintain a price above $195. Therefore, in my best estimation, the 190/195 bull call spread expiring Feb. 20, 2026 stands out.
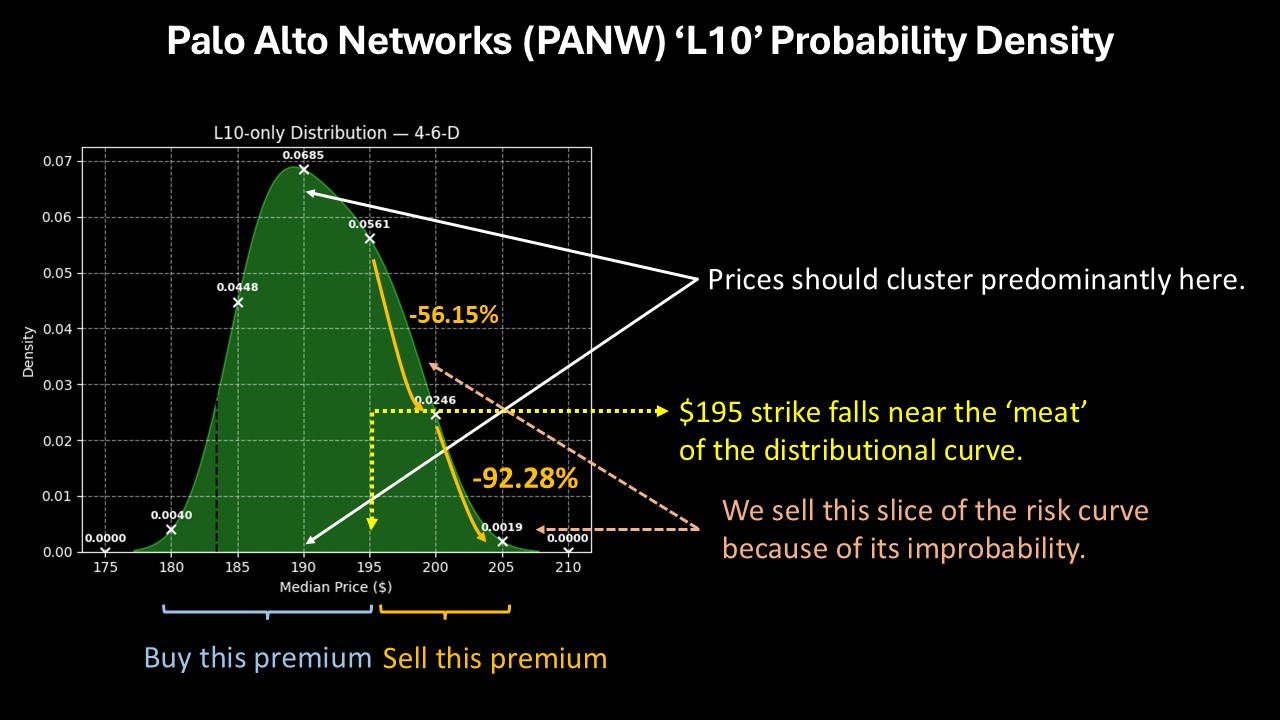
This wager requires two simultaneous transactions on a single execution: buy the $190 call and sell the $195 call, for a net debit paid of $230 (the most that can be lost). Should PANW stock rise through the second-leg strike at expiration, the maximum profit is $270, a payout of over 117%.
Aside from the probabilistic nature of the $195 strike, the other reason to consider the above spread is probability decay. From $190 to $195, probability density only declines by 18.1%. However, from $195 to $200, density plunges by 56.15%. From $200 to $205, the decline is quite bad at 92.28%.
Ultimately, the 190/195 bull spread allows us to balance reward potential while limiting opportunity cost. As I said earlier, buy the reality, sell the fantasy.
On the date of publication, Josh Enomoto did not have (either directly or indirectly) positions in any of the securities mentioned in this article. All information and data in this article is solely for informational purposes. For more information please view the Barchart Disclosure Policy here.
More news from Barchart