Stocks have had a strong year, but one corner of the market has quietly outperformed nearly everything else: precious metals.
Silver (SIH26) is up over 113% year-to-date, dramatically outperforming gold (GCG26) and doing so by the widest margin in more than four years. That kind of divergence doesn’t happen often — and when it does, it usually carries important signals beneath the surface.
In this Market on Close clip, Senior Market Strategist John Rowland, CMT, breaks down what’s driving silver’s explosive move, why it may be getting stretched, and why this historic run could be quietly setting up gold’s next opportunity.
Why Silver Has Led the Charge
Silver’s rally hasn’t happened in isolation. Platinum (PLF26) and palladium (PAH26) have also surged, reinforcing that this is a broader precious metals move, not just a one-off trade.
But silver stands out for one reason: volatility.
Silver tends to move faster and further than gold in both directions. That’s why traders often call it one of the most explosive metals — capable of sharp upside, but also rapid pullbacks.
John highlights two technical clues suggesting silver may be getting extended:
- Bollinger Bands are at their widest level in over a year, signaling elevated volatility
- Fibonacci extensions show price reaching zones that historically align with exhaustion, rather than fresh breakouts
That doesn’t mean silver’s rally has to stop here. In powerful trends, price can always go further — and John notes upside levels that could push silver into the low-to-mid $70s. But historically, these conditions often precede pauses or rotations, not continued straight-line moves.
The Gold-Silver Ratio: The Quiet Signal
The real insight comes from stepping back and looking at relative value, not just price.
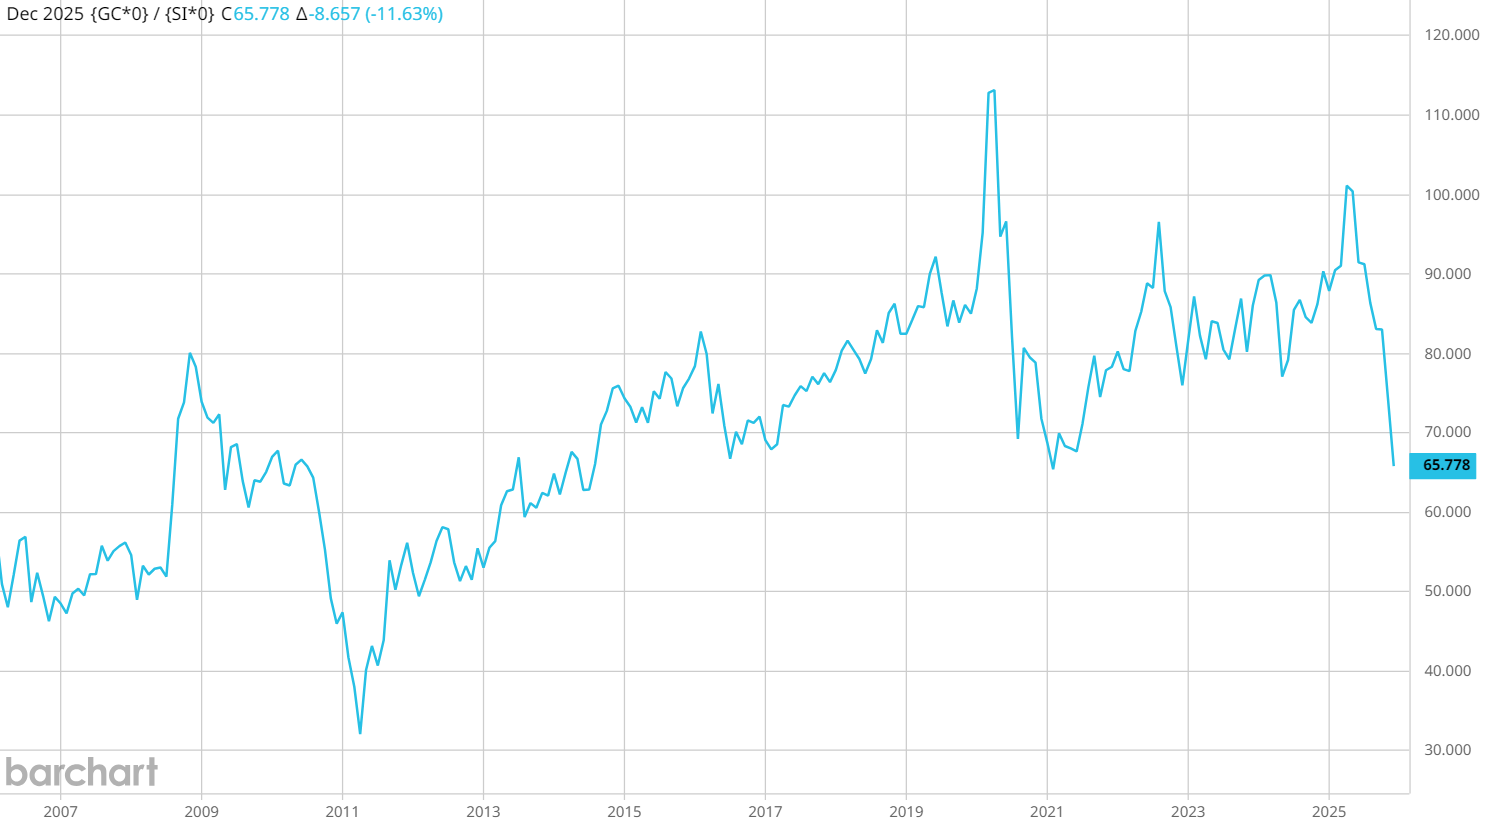
John introduces the gold-silver ratio, a simple calculation that divides gold prices by silver prices. Over the decades, this ratio has oscillated around long-term equilibrium zones.
Right now, the ratio sits near 65, a level that has repeatedly acted as a turning point historically.
Importantly, the ratio doesn’t predict direction. Instead, it signals relative opportunity.
At current levels:
- Silver appears stretched relative to gold
- Gold looks historically undervalued compared to silver
That creates two possible paths:
- Silver pauses or pulls back while gold catches up
- Both rise, but gold begins outperforming from here
Either way, the historical relationship suggests a potential buying opportunity for gold bulls.
Why Gold Often Lags, Then Surprises
Gold doesn’t usually lead rallies. It tends to be slower, steadier, and less emotional than silver.
But historically, after silver’s explosive phases cool, gold often follows with a more sustained trend — especially when macro conditions remain supportive.
With falling real rates, ongoing central bank demand, and persistent currency debasement concerns, gold’s longer-term backdrop remains constructive — even while silver steals the spotlight.
How Traders and Investors Can Use This Information
To capitalize on the opportunity here, traders may want to:
- Monitor silver for momentum exhaustion
- Track the gold-silver ratio for further confirmation
- Look for gold breakouts once silver stabilizes
Investors may want to:
- Reassess precious metals exposure
- Consider adding gold while it’s cheap
- Use Barchart Opinion to spot trend confirmation
Barchart makes this analysis accessible through:
- Futures Performance Leaders pages
- Bollinger Band studies
- Gold/Silver ratio using f(x) Expression Builder
The Bottom Line
Silver’s record-setting run is real, but history suggests that divergences like this can mark transition points in asset relationships. That creates opportunities for traders.
The gold-silver relationship is flashing a signal worth paying attention to. It may not mean silver collapses, but it does suggest gold’s time to run could be approaching.
Watch this clip on the Gold/Silver Ratio:
On the date of publication, Barchart Insights did not have (either directly or indirectly) positions in any of the securities mentioned in this article. All information and data in this article is solely for informational purposes. For more information please view the Barchart Disclosure Policy here.
More news from Barchart