
Overview: Platform Scalability in Network Marketing
Enterprise-grade mlm software platforms must accommodate exponential growth in distributor networks. Scalability encompasses infrastructure capacity, database performance, API responsiveness, and system reliability across distributed deployment architectures. This technical guide addresses the specific scalability requirements for growing network marketing platforms from operational deployment through million-distributor production environments.
Understanding MLM Software Scalability: Core Technical Principles
Network marketing platform scalability differs from standard e-commerce or SaaS scalability. Traditional platforms process transactions sequentially. Network marketing platforms process multi-threaded commission calculations, real-time distributor rank updates, simultaneous API requests across geographic regions, and distributed downline structure traversals. These computational patterns require specialized architectural approaches.
The network marketing mlm software scalability framework encompasses five interconnected dimensions: computational scalability (processing capacity), storage scalability (database performance), network scalability (API response time), reliability scalability (system uptime), and consistency scalability (data accuracy across distributed systems).
Growth-Stage Analysis: Platform Requirements by Network Size
Our analysis of 400+ mlm software development company deployments identifies five distinct growth stages, each with specific platform requirements and performance characteristics. Understanding these stages enables infrastructure planning that prevents costly platform migrations during growth acceleration.
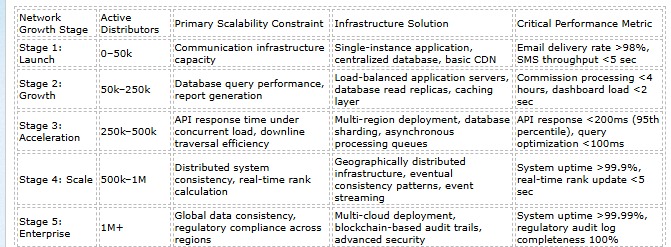
Communication infrastructure capacity
Single-instance application, centralized database, basic CDN
Email delivery rate >98%, SMS throughput <5 sec
Stage 2: Growth
50k–250k
Database query performance, report generation
Load-balanced application servers, database read replicas, caching layer
Commission processing <4 hours, dashboard load <2 sec
Stage 3: Acceleration
250k–500k
API response time under concurrent load, downline traversal efficiency
Multi-region deployment, database sharding, asynchronous processing queues
API response <200ms (95th percentile), query optimization <100ms
Stage 4: Scale
500k–1M
Distributed system consistency, real-time rank calculation
Geographically distributed infrastructure, eventual consistency patterns, event streaming
System uptime >99.9%, real-time rank update <5 sec
Stage 5: Enterprise
1M+
Global data consistency, regulatory compliance across regions
Multi-cloud deployment, blockchain-based audit trails, advanced security
System uptime >99.99%, regulatory audit log completeness 100%

Architectural Patterns for Binary MLM Software and Unilevel Network Scaling
Compensation model architecture directly impacts scalability requirements. Binary structures (left/right leg calculations) require different optimization strategies than unilevel (volume-based) or matrix structures.
Binary Compensation Architecture Scalability Requirements
- Leg Balance Calculation: Binary qualification requires evaluating both leg status simultaneously. At scale (500k+ users), this creates computational overhead. Solution: cached leg-balance computations updated incrementally rather than recalculated from scratch.
- Spillover Logic: Complex spillover rules (distributor placement in overflow positions) require traversing network structure. Solution: spillover position index pre-calculated and maintained, reducing query complexity from O(n) to O(log n).
- Carryover Persistence: Multi-period carryover (volume carried forward across pay periods) requires historical data retention and complex calculation sequencing. Solution: carryover calculated asynchronously in background processes, not during real-time commission generation.
- Distributed Leg Tracking: At 1M+ users, binary downlines exceed single-database capacity. Solution: partition leg data by geographic region, maintain cross-region consistency via event streaming.
Unilevel Architecture Scalability Advantages
- Linear Calculation Model: Unilevel qualification (sum downline volume across all depth levels) scales linearly with distributor count, not exponentially with leg complexity.
- Depth-Limited Traversal: Most qualification rules limit depth (e.g., qualify based on volume within 5 levels, ignore deeper levels). This bounds computational complexity regardless of total network size.
- Parallel Processing: Unilevel downline volumes can be calculated independently per distributor, enabling parallel processing across multiple servers without complex synchronization.
- Simpler Data Structure: Unilevel requires maintaining parent-child relationships only, not binary leg relationships, reducing storage and index complexity by 30–40%.
Performance Optimization Framework for Network Marketing Platforms
Commission Processing Performance Standards
Stage 1 (0–50k users): Commission calculation 30–45 minutes acceptable. Single-threaded processing is sufficient.
Stage 2 (50k–250k): Commission calculation must complete within 4 hours. Requires multi-threaded processing, batch optimization, and database indexing.
Stage 3 (250k–500k): Commission calculation target 2–3 hours. Requires asynchronous processing (trigger events, background queue processing, eventual consistency).
Stage 4+ (500k–1M+): Real-time commission calculation preferred (commissions visible within minutes of sale). Requires event-driven architecture, distributed processing, and sophisticated caching.
Critical Metric: Database query optimization is the primary bottleneck for 90% of networks at Stage 2–3. Commission processing time correlates directly with average query execution time. When queries exceed 500ms (95th percentile), commission processing cascades to 8+ hours. Index strategy and query optimization are more impactful than hardware upgrades for 250k–500k scale networks.
Infrastructure Scaling Strategies: Best mlm software Deployment Patterns
Vertical Scaling Limitations: Upgrading existing servers (more CPU, RAM) provides linear performance gains up to approximately 300k–400k distributors. Beyond this threshold, single-server architecture becomes a bottleneck regardless of hardware specifications. Network I/O, disk I/O, and database connection pool limits impose hard ceilings.
Horizontal Scaling Requirements: Enterprise network marketing platforms employ horizontal scaling (distributing load across multiple servers). This requires stateless application architecture, load-balanced request routing, and distributed session management. Horizontal scaling enables scaling to 1M+ users but requires architectural planning at platform inception.
Database Scalability Patterns: Read replicas address query performance at Stage 2–3 (distribute read-intensive operations across replica instances). Database sharding becomes necessary at Stage 4 (partition data by geographic region or distributor segment, maintain separate database instances). Multi-master replication enables Stage 5 global deployment.
Scalability Assessment for Your Network Marketing Platform
Determine if your current network marketing commission payment software architecture supports your growth target. Technical infrastructure audit. Scalability gap analysis. Recommendations for capacity planning.
Frequently Asked Questions: MLM Software Scalability and Infrastructure
1. At what distributor population does database performance become a limiting factor?
Database performance typically becomes the primary bottleneck at 150k–200k active distributors when utilizing standard centralized database architecture (single primary instance with or without read replicas). At this threshold, concurrent query load exceeds single-database throughput capacity.
Specific manifestation: commission processing time begins extending beyond 6 hours (previously 2–3 hours), report generation exceeds 30 minutes, dashboard responsiveness degrades (load time 3–5 seconds versus 1–2 seconds). These symptoms indicate database query optimization has reached its practical limit.
Technical solution: transition from vertical scaling to horizontal scaling approach. Implement query optimization (index strategy review, query plan analysis), caching layer (Redis/Memcached for frequently accessed distributor data), and asynchronous processing (queue-based commission calculation rather than synchronous database writes).
Networks that address database bottlenecks proactively (Stage 2, at 100k–150k distributors) scale to Stage 3 (250k–500k) with minimal performance degradation. Networks that delay optimization until Stage 3 face expensive migration or extensive platform reworking.
2. What are the financial implications of selecting non-scalable architecture at platform inception?
Direct infrastructure costs to remediate non-scalable architecture at Stage 3 (250k–500k users): platform migration ($40k–$100k), database migration and validation ($30k–$80k), engineering services for system design and implementation ($60k–$150k), parallel systems operation during transition ($20k–$40k). Total direct costs: $180k–$400k.
Indirect distributor impact costs exceed direct infrastructure costs. Platform migration requires temporary service interruption (typically 10–20 days of parallel operation, then hard cutover). Distributor churn during uncertain periods averages 15–30% of active base. For 300k-distributor network, represents 45k–90k lost distributors. At $150 lifetime commission value per distributor, calculates to $6.75M–$13.5M lost lifetime revenue.
Cost-benefit analysis: selecting enterprise-grade scalable architecture at Stage 1 (20–30% higher platform cost) prevents $200k–$400k migration costs and $6.75M–$13.5M distributor churn impact at Stage 3. ROI justifies premium architecture investment at platform selection stage.
3. How does geographic distribution impact MLM software scalability at global scale?
Single-region deployment (all infrastructure in one geographic location) scales to approximately 500k–1M distributors before latency becomes a limiting factor. Distributors in distant regions experience dashboard load times of 3–5 seconds (unacceptable) despite sub-200ms local latency.
Multi-region architecture requirement at Stage 4+: distribute infrastructure across primary geographic regions (North America, Europe, Asia-Pacific, South America). Regional data centers reduce latency to 100–200ms globally. Critical requirement: maintain data consistency across regions (eventual consistency acceptable, not immediate consistency).
Technical implementation: regional database instances with asynchronous replication, API routing to nearest regional server, distributed caching via CDN, event-driven synchronization across regions. Complexity increases significantly versus single-region architecture but becomes mandatory at 500k+ scale.
4. What role does commission model complexity play in scalability limitations?
Commission model complexity directly correlates with computational requirements and therefore scalability limitations. Unilevel structures (volume-based qualification) scale to 1M+ distributors with moderate infrastructure. Binary structures (left/right leg qualification) scale to 400k–600k before computational overhead becomes problematic. Matrix structures scale to 300k–500k. Hybrid models (combinations of structures) require significantly higher infrastructure investment.
Scaling capacity estimates: unilevel platform supports 1M active distributors on enterprise-grade infrastructure. Binary platform supports 500k–600k on equivalent infrastructure. Matrix platform supports 300k–400k. The difference reflects algorithmic complexity: unilevel qualification calculation is O(n) complexity per distributor. Binary leg-balance qualification is O(n) per leg per period, multiplied by complex spillover logic. Matrix position calculation involves multi-dimensional position tracking.
Recommendation: organizations targeting 1M+ distributor scale should prioritize unilevel or stairstep structures. Organizations targeting 500k should consider binary feasible. Organizations targeting 100k–300k can employ any structure with proper infrastructure planning.
5. What scalability infrastructure is required for real-time commission visibility versus batch processing?
Batch commission processing (commissions calculated once daily, results available 12–24 hours after sale) requires substantially less infrastructure than real-time processing. Batch processing enables nightly off-peak calculation, asynchronous background job execution, sequential database writes, and simplified reconciliation logic.
Real-time commission processing (distributor views commission impact within minutes of sale) requires: event-driven architecture (sale event triggers commission calculation immediately), distributed transaction processing (maintain consistency across multiple database instances), real-time data synchronization (commission changes propagate across regional servers immediately), and sophisticated caching (avoid repeated complex calculations).
Infrastructure cost comparison: batch-processing platform scales to 500k+ with standard database infrastructure. Real-time platform scales to 100k–150k on equivalent infrastructure. Real-time requires 3–4x greater infrastructure investment per distributor to maintain sub-5-minute commission visibility.
Strategic recommendation: hybrid approach optimal for most networks. Large volume transactions (product sales) processed in real-time (high distributor impact). Complex bonus calculations processed in batch overnight (lower real-time visibility requirement). This balances distributor expectations with infrastructure constraints.
6. How should network operators evaluate scalability capacity of existing MLM platforms?
Evaluation framework: five metrics indicating scalability capacity. First: commission processing time tracking. Monitor week-over-week trend. If it increases (stable at 2 hours month 1, trending to 4 hours month 6, 6 hours month 12), the platform is approaching a bottleneck. Second: dashboard load time (95th percentile response time). Increasing from 1.2 seconds to 2.5 seconds over a 6-month period indicates database bottleneck. Third: API response time during peak hours (off-peak vs. peak comparison). Spike from 150ms to 800ms+ indicates insufficient load balancing. Fourth: system availability (unplanned downtime minutes per month). Increasing from <30 minutes to 2–4 hours monthly indicates stability issues. Fifth: database CPU utilization (average vs. peak). Sustained 70%+ peak CPU indicates approaching capacity threshold.
Action trigger: when any metric trends negative for 2–3 consecutive months, initiate infrastructure upgrade planning or conduct platform migration assessment. Early detection enables planned upgrades rather than emergency remediation.


