The National Renewable Energy Laboratory (NREL) released its annual cost breakdown of installed solar photovoltaic (PV) and battery storage systems.
U.S. Solar Photovoltaic System and Energy Storage Cost Benchmarks, With Minimum Sustainable Price Analysis: Q1 2022 details installed costs for PV and storage systems as of the first quarter (Q1) of 2022.
The report said that prices soared throughout the U.S. between Q1 2021 and Q1 2022 for the PV and energy storage markets in particular. The ongoing COVID-19 pandemic caused or complicated supply chain constraints, and industry-specific events and trade policies drove up PV and battery prices.
Such volatility poses a challenge for capturing representative PV and storage costs. NREL’s benchmark report, published annually since 2010, is meant to help the U.S. Department of Energy’s Solar Energy Technologies Office track long-term technology and soft cost trends. For this reason, NREL said the Q1 2022 report is the first to use two types of benchmarks to help distinguish the impacts of short-term market distortions from the impacts of longer-term technology trends.
Two benchmarksThe two types of benchmarks in the new report are the minimum sustainable price (MSP) and the modeled market price (MMP).
MSP is a theoretical national-average cash price under long-term market conditions. NREL said that for this report, MSP excluded short-term cost distortions impacting the market in Q1 2022. In contrast, the report’s MMP is an estimate of the national-average cash sales price under market conditions occurring in Q1 2022, consistent with NREL’s previous benchmarks.
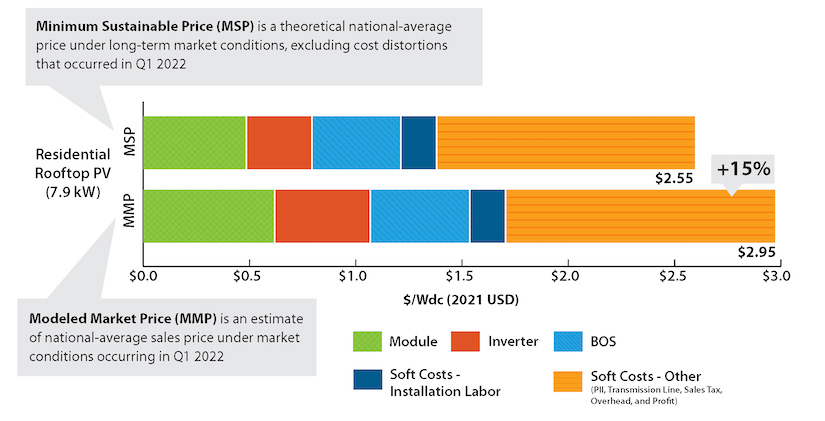
The chart below provides an example comparing MSP and MMP for a residential PV system. Differences between the two benchmarks stem from different input parameters.
Taking each of the component costs in turn: For the PV module, MSP is based on an NREL MSP model and excludes tariffs and short-term supply/demand dynamics, whereas the module MMP, based on third-party analyst data, includes costs from tariffs and supply/demand market dynamics. The inverter MSP is based on an average cost trend (excluding distorted 2022 costs) and no tariff impacts, whereas the inverter MMP is based on 2022 costs with tariff impacts. Similarly, the balance of system (BOS) MSP is based on an average cost trend that excludes 2022 costs, and the BOS MMP is based on 2022 costs. Soft cost input parameters are the same for MSP and MMP.
Two Ways To Look at PV System Price in 2022 NREL’s MSP and MMP benchmarks differ in both purpose and methodology. For the MSP benchmark, which is useful for long-term analysis and making research and development investment decisions, distorted input costs are removed from model calculations. For the MMP benchmark, which is useful for near-term policy and market analysis based on disaggregated system costs, reported market costs and prices of different sub-cost components are used in the calculations.
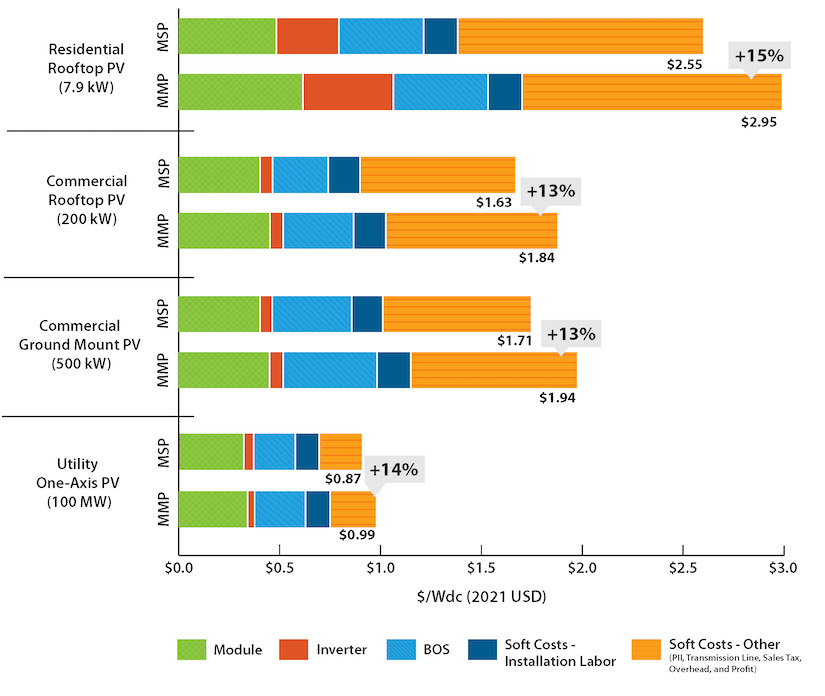
 The next chart shows NREL’s MSP and MMP PV benchmarks across the residential, commercial, and utility-scale sectors. Discrepancies between benchmark types are similar for all sectors, at 13%–15%, representing the impact of either excluding (MSP) or including (MMP) inflationary market and policy distortions. Although not shown in the chart, NREL said the differences between MSP and MMP are similar for standalone storage and PV-plus-storage systems.
MSP vs MMP for Standalone PV Systems in Q1 2022 Since 2010, NREL has benchmarked the disaggregated costs of PV systems—including installation costs—for residential, commercial, and utility-scale projects. In 2022, these benchmarks compare a theoretical MSP to an MMP that estimates the national-average sales price under market conditions occurring in Q1 2022. These results show the 13%–15% difference between MSP and MMP for standalone PV systems in Q1 2022.
 Because the methods used to develop the 2022 MMP benchmarks are similar to the methods used to develop NREL’s benchmarks in 2021, many of those results can be compared across years. The Q1 2022 MMP PV, storage, and PV-plus-storage benchmarks are 2%–12% higher than comparable Q1 2021 benchmarks in real dollars. These differences, NREL said, could be considered estimates of the increase in national-average system sales prices between Q1 2021 and Q1 2022.
Industry dataThe MSP and MMP benchmarks are both based on NREL’s ongoing collection of industry data and its bottom-up cost modeling. The data include representative PV and storage system specifications based on industry trends as well as feedback from stakeholders. This year, the report’s authors interviewed 21 stakeholders, including third-party research organizations; PV installers and integrators; engineering, procurement, and construction (EPC) developers; advocacy groups; intergovernmental organizations; and government agencies.
Bottom-up modeling accounts for all system and project development costs incurred during installation, including typical installation techniques and business operations. Hardware costs reflect the purchase price of components as well as the sales price paid to the installer, including profits. The results are broken down by cost category to illustrate which system components may be driving prices and to identify opportunities for price reductions.
From these same data and modeling approaches, the MSP and MMP benchmarks are differentiated by identifying cost distortions from short-term market and policy conditions and then including or excluding distorted cost inputs, as described above.