Most traders lose money in options for one reason: They’re guessing.
They’re following Discord alerts, chasing momentum, and buying premiums without understanding what the market is actually pricing in.
The difference between retail traders and professionals isn’t luck. It’s workflow.
In this quick explainer, we’re walking through exactly how to use Barchart’s Options Dashboard to stop guessing and start trading with data.
Step 1: Follow the Options Activity
Everything starts here.
The Most Active Options page isn’t just a list; it’s a real-time map of where money is moving.
Look for this first: Options Volume vs. Open Interest. If volume is significantly higher than open interest, it signals new positions are being initiated. That means traders are opening fresh bets, not just closing old ones.
This is Unusual Options Activity – where the move starts, not where it ends.
Step 2: Check Volatility (Are You Overpaying?)
Before entering any trade, check implied volatility (IV).
This determines whether you should be:
- Buying options (low IV → cheaper premiums)
- Selling options (high IV → expensive premiums)
Most traders ignore this factor and end up overpaying. If IV is elevated and you’re buying calls or puts, you’re already late to the party.
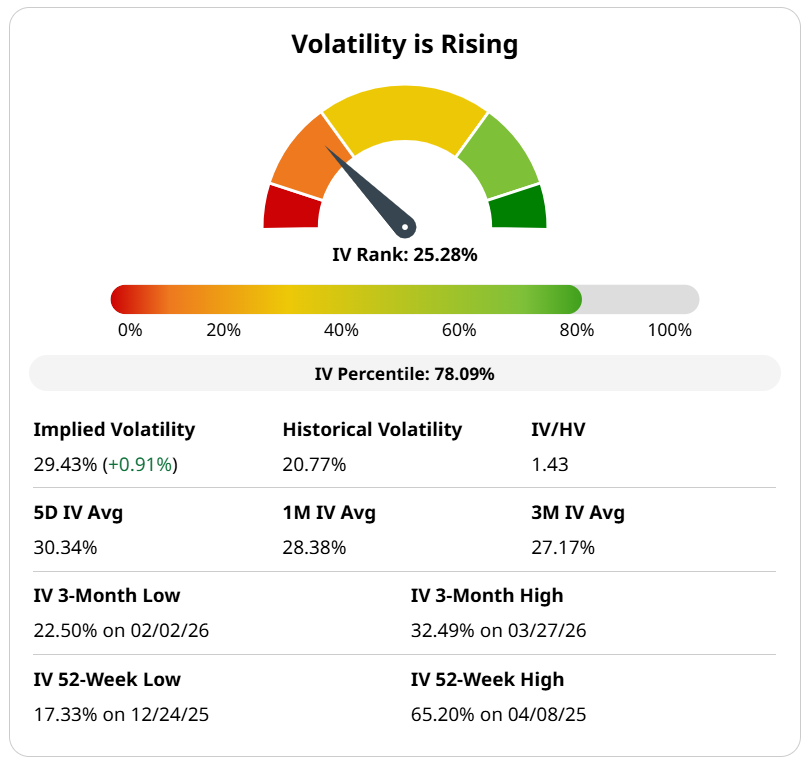
This is how you can lose money, even if you’re right on direction.
Step 3: Align With the Trend
This is where most people lose. They try to call tops or to catch reversals, instead of asking one simple question: Is the trend bullish or bearish?
- If the trend is up, focus on bullish setups.
- If the trend is down, focus on bearish setups.
There’s a wise saying in the market to remember always: The trend is your friend. Don’t fight the tape!
Step 4: Use Expected Move (Market Maker Math)
This is one of the most underused tools. The Expected Move shows how far the market expects a stock to move over a given time period.
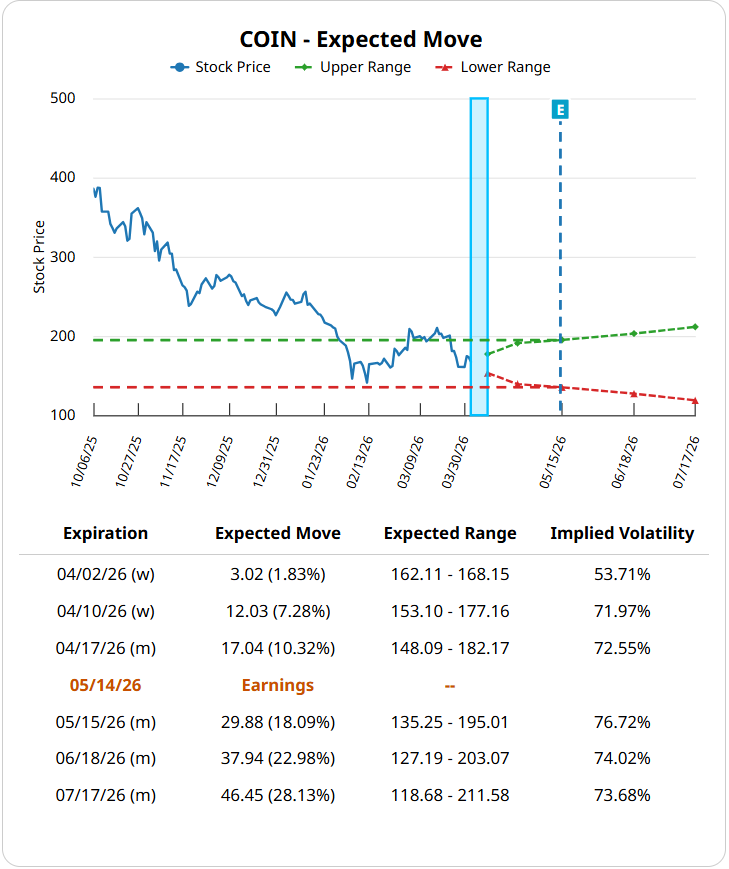
This is not opinion; this is pricing based on options data.
Key insight:
- If price is inside the expected move → normal behavior
- If price moves outside the predicted range → stretched / potential reversal
This gives you context most traders don’t have. It also keeps you from setting unrealistic price targets when selecting a strike price.
Step 5: The Hidden Edge (Put/Call Ratio)
This is where things get interesting.
The Put/Call Ratio tells you how traders are positioned:
- Higher Open Interest ratio → heavy put skew (fear/hedging)
- Lower Open Interest ratio → heavy call skew (greed/complacency)
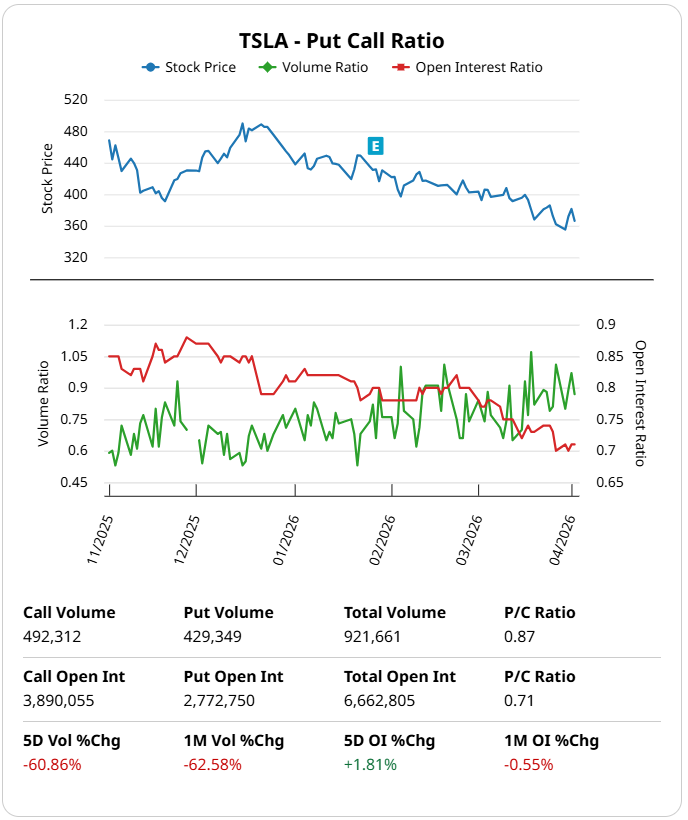
When this indicator hits extremes, it often signals:
- Panic or euphoria
- Potential reversal points
This is where the “rubber band” effect shows up.
Putting It All Together
This is the workflow:
- Find activity → Most Active Options
- Check pricing → Implied Volatility
- Confirm direction → Trend
- Measure range → Expected Move
- Market sentiment → Put/Call Ratio
That’s how you make the move from guessing to trading with structure.
Trading options isn’t gambling. It’s probability, positioning, and pricing. If you’re not using a workflow, you’re reacting. And in this market, reacting without strategy is where money gets lost.
Watch this quick video clip:
- Discover more in the Options Learning Center
- Analyze your favorite stocks with the Options Dashboard
On the date of publication, Barchart Insights did not have (either directly or indirectly) positions in any of the securities mentioned in this article. All information and data in this article is solely for informational purposes. For more information please view the Barchart Disclosure Policy here.
More news from Barchart