
- Year-over-year price growth continues its downward trend, only rising 1.3% in August 2025. Monthly price increases were in negative territory (down 0.3%) between July and August 2025, following a 0.2% decline in July.
- Bridgeport, CT; Newark and Camden, NJ; Rochester NY; and Chicago, IL lead for price growth among the top 100 metros.
- Negative home price growth is mainly concentrated in Florida, which is where seven of the top 10 metros reporting negative growth are located.
Cotality™, a leader in property information, analytics, and data-enabled solutions, released its Home Price Index™ for August 2025 today. In August, price growth was 1.3% year-over-year, as home sales activity continues to trend along multi-decade lows.
This press release features multimedia. View the full release here: https://www.businesswire.com/news/home/20251008722212/en/
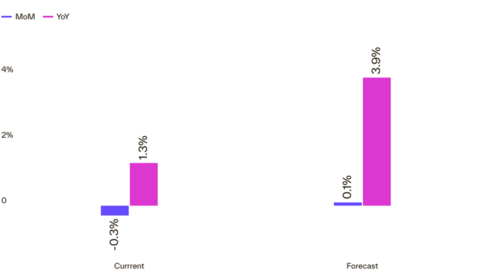
Chart 1: National home price growth. August 2025 data. Source: Cotality
The housing market remains the strongest in the Northeastern states, where home price growth has increased by 6% to 7% compared to last year. Meanwhile, negative home price growth is dominating areas of the South and the West. Florida, Washington D.C., Colorado, Hawaii, Arizona, Texas, and California all showed negative price appreciation in August.
Median home price increases have slowed too, resulting in the median home price in the U.S. decreasing slightly to $400,000. Lower home prices, slower price appreciation, and a recent decline in mortgage rates have contributed to improved overall affordability, which is now at its most favorable level since 2022 when mortgage rates began rising.
“Enhanced affordability has provided much-needed relief to the housing market, which has experienced limited momentum over the past two years,” said Cotality Chief Economist Dr. Selma Hepp. “Consequently, recent increases in mortgage application activity indicate that homebuyers are gradually re-entering the market. Rising inventories are providing buyers with more choices while price cuts are now more common in certain local markets. This has slowly shifted negotiating power towards buyers – if they can afford to act. But, with some sellers pulling back and further expected decline in mortgage rates, price pressures could resurge.”
While home price growth has slowed, further weakening across the number of markets has slowed too. In August, fewer metros recorded year-over-year declines than in July. Notably, San Francisco experienced reacceleration in price growth since the spring due to the AI boom and return of the demand in the city, which is now one of the strongest markets in the Bay Area.
"The housing market remains at a crossroads—where mortgage rates, inventory shifts, local dynamics, and policy decisions converge. Whether demand unlocks further or stalls will depend not just on market and economic fundamentals, but perhaps, most crucially, on consumer sentiment which remains fragile particularly when it comes to job security and financial prospects. Until buyers feel confident in both the market and their own financial footing, many will remain on the sidelines.”
The next Cotality Home Price Index will be released on November 4, featuring data for September 2025. For ongoing housing trends and data, visit the Cotality Insights blog: www.cotality.com/insights.
Methodology
The Cotality HPI™ is built on industry-leading public record, servicing and securities real-estate databases and incorporates more than 45 years of repeat-sales transactions for analyzing home price trends. Generally released on the first Tuesday of each month with an average five-week lag, the Cotality HPI is designed to provide an early indication of home price trends by market segment and for the Single-Family Combined tier, representing the most comprehensive set of properties, including all sales for single-family attached and single-family detached properties. The indices are fully revised with each release and employ techniques to signal turning points sooner. The Cotality HPI provides measures for multiple market segments, referred to as tiers, based on property type, price, time between sales, loan type (conforming vs. non-conforming) and distressed sales. Broad national coverage is available from the national level down to ZIP Code, including non-disclosure states.
Cotality HPI Forecasts™ are based on a two-stage, error-correction econometric model that combines the equilibrium home price—as a function of real disposable income per capita—with short-run fluctuations caused by market momentum, mean-reversion, and exogenous economic shocks like changes in the unemployment rate. With a 30-year forecast horizon, Cotality HPI Forecasts project Cotality HPI levels for two tiers — Single-Family Combined (both attached and detached) and Single-Family Combined Excluding Distressed Sales. As a companion to the Cotality HPI Forecasts, Stress-Testing Scenarios align with Comprehensive Capital Analysis and Review (CCAR) national scenarios to project five years of home prices under baseline, adverse and severely adverse scenarios at state, metropolitan areas and ZIP Code levels. The forecast accuracy represents a 95% statistical confidence interval with a +/- 2% margin of error for the index.
About Market Risk Indicators
Market Risk Indicators are a subscription-based analytics solution that provide monthly updates on the overall health of housing markets across the country. Cotality data scientists combine world-class analytics with detailed economic and housing data to help determine the likelihood of a housing bubble burst in 392 major metros and all 50 states. Market Risk Indicators is a multi-phase regression model that provides a probability score (from 1 to 100) on the likelihood of two scenarios per metro: a >10% price reduction and a ≤ 10% price reduction. The higher the score, the higher the risk of a price reduction.
About the Market Condition Indicators
As part of the Cotality HPI and HPI Forecasts offerings, Market Condition Indicators are available for all metropolitan areas and identify individual markets as overvalued, at value or undervalued. These indicators are derived from the long-term fundamental values, which are a function of real disposable income per capita. Markets are labeled as overvalued if the current home price indexes exceed their long-term values by greater than 10% and undervalued where the long-term values exceed the index levels by greater than 10%.
Source: Cotality
The data provided are for use only by the primary recipient or the primary recipient's publication or broadcast. This data may not be resold, republished or licensed to any other source, including publications and sources owned by the primary recipient's parent company without prior written permission from Cotality. Any Cotality data used for publication or broadcast, in whole or in part, must be sourced as coming from Cotality, a data and analytics company. For use with broadcast or web content, the citation must directly accompany first reference of the data. If the data are illustrated with maps, charts, graphs or other visual elements, the Cotality logo must be included on screen or website. For questions, analysis or interpretation of the data, contact Charity Head at newsmedia@Cotality.com. Data provided may not be modified without the prior written permission of Cotality. Do not use the data in any unlawful manner. The data are compiled from public records, contributory databases and proprietary analytics, and its accuracy is dependent upon these sources.
About Cotality
Cotality accelerates data, insights, and workflows across the property ecosystem to enable industry professionals to surpass their ambitions and impact society. With billions of real-time data signals across the life cycle of a property, we unearth hidden risks and transformative opportunities for agents, lenders, carriers, and innovators. Get to know us at www.cotality.com.
View source version on businesswire.com: https://www.businesswire.com/news/home/20251008722212/en/
"The housing market remains at a crossroads—where mortgage rates, inventory shifts, local dynamics, and policy decisions converge." -Dr. Selma Hepp, Cotality Chief Economist
Contacts
Media Contact
Charity Head
Cotality
newsmedia@corelogic.com