Quarch compares three Enterprise drives in a lab to see how they differ
Our initial expectations were that the Toshiba SSD would fall well behind the other two, the Samsung drive to use more power due to its high capacity, and the Optane SSD to be a clear winner.”
AVIEMORE, UNITED KINGDOM, June 10, 2021 /EINPresswire.com/ -- Who will be the Enterprise Drive winner - Power or Performance? — Andy Norrie
It's not what we expected
Quarch Technology compares three Enterprise drives in a lab to see how they differ
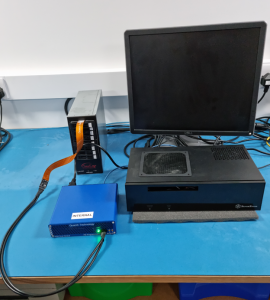
In order to see how different drives perform, Quarch Technology compared them in the lab. A standard test station was used to set up all drives: Small form factor PCs made from consumer-grade components. We used SerialCables host cards, cables, and JBOD for a quick and easy setup. We ran Quarch Compliance Suite using the Power Vs Performance test (v1.0). Each drive started in an empty, formatted state. Of course, these specific workloads may not pick up on some specific case you are interested in.
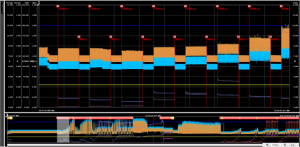
The Power Vs Performance test has multiple sections, each of which looks at one specific workload type. It takes several hours to run the whole test (over 24 hours for the larger drives). Each part of the test provides fascinating insights into how the drive operates.
The entire test run can be viewed, with a high-resolution recording of power data. The workload performance is added in real-time, giving a very detailed insight into the drive performance. An additional PDF report is generated, giving detailed statistics on each workload, including a power-performance metric in megabytes per-second-per-watt.
To see more results, visit our blog Enterprise drives power performance.
Conclusion
This was a fascinating process for us, being the first time we have been able to capture so much power and performance data and with so little effort. While some of the results were expected, the way that power consumption and performance can vary within a single workload is very interesting.
The good news is that if you do not like the FIO workloads we have chosen, you’ll soon be able to select your own! The next release of QCS is planned to have a custom Power Vs Performance test, where you can select one or more of your workload files to run.
About Quarch
Quarch Technology Ltd is a world-leading supplier of automated test tools for Storage Systems. Scalable test systems enable manufacturers and re-sellers of data storage to get to market faster with a more reliable product. Their groundbreaking and highly customizable solutions can be tailored to our customer’s needs, allowing the system to achieve a very rapid return on investment in any test environment. For more information, visit: www.quarch.com
© 2021 Quarch Technology Ltd. All rights reserved. Quarch Technology and the Quarch logo are registered trademarks of Quarch Technology Ltd.
Andy Norrie
Quarch Technology
+44 1343 508140
Andy.norrie@quarch.com
Visit us on social media:
Facebook
Twitter
LinkedIn
The next release of QCS is planned to have a custom Power Vs Performance test, where you can select one or more of your workload files to run.


