I concluded my late October Q3 Barchart article on the energy sector with the following:
Natural gas is heading into the peak demand season, when uncertainty about the weather will peak as inventories begin to decline in late November. Therefore, nearly U.S. natural gas prices could recover to the $4 per MMBtu level, or higher, over the coming weeks and months. U.S. natural gas prices for January 2026 delivery were already trading near $4.30 per MMBtu on October 20.
Don’t Miss a Day: From crude oil to coffee, sign up free for Barchart’s best-in-class commodity analysis.
In November, U.S. natural gas for January delivery was marginally higher at the $4.35 per MMBtu level, as the injection season is in its final days.
Natural gas inventories are near the same level as last year
With the 2025 injection season winding down, U.S. natural gas inventories are slightly lower than last year.
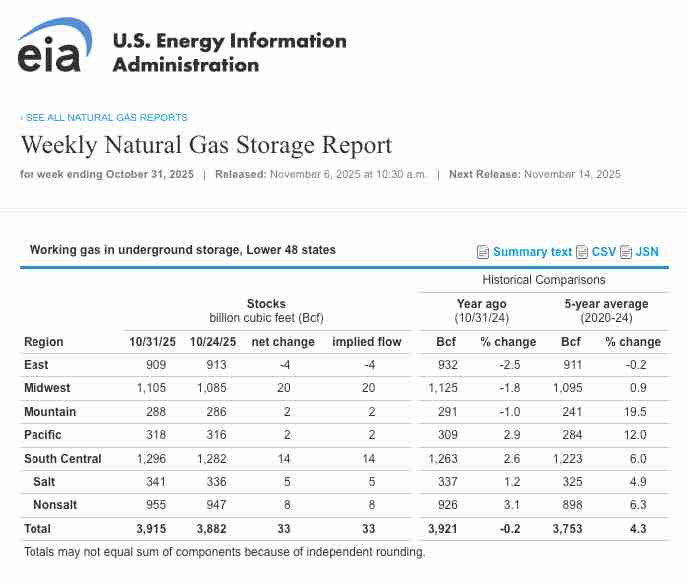
As the chart highlights, natural gas stockpiles across the United States, at 3.915 trillion cubic feet, were 0.2% lower than at the same time in 2024 and were 4.3% higher than the five-year average as of the week ending on October 31. While stocks are higher, the energy commodities trend has been higher since mid-October.
The daily trend is higher
The six-month chart of NYMEX natural gas futures for December 2025 delivery highlights the bullish trend since the low on October 17, 2025.

As the chart shows, December NYMEX natural gas futures have increased by nearly 23% from the October 17 low of $3.595 to the November 5 high of $4.42 per MMBtu.
The monthly chart highlights that the first target is above $4.90 per MMBtu
While the daily chart illustrates a bullish trend over the past weeks, the monthly chart shows that the upside target, as the withdrawal season approaches, is just below $5 per MMBtu.
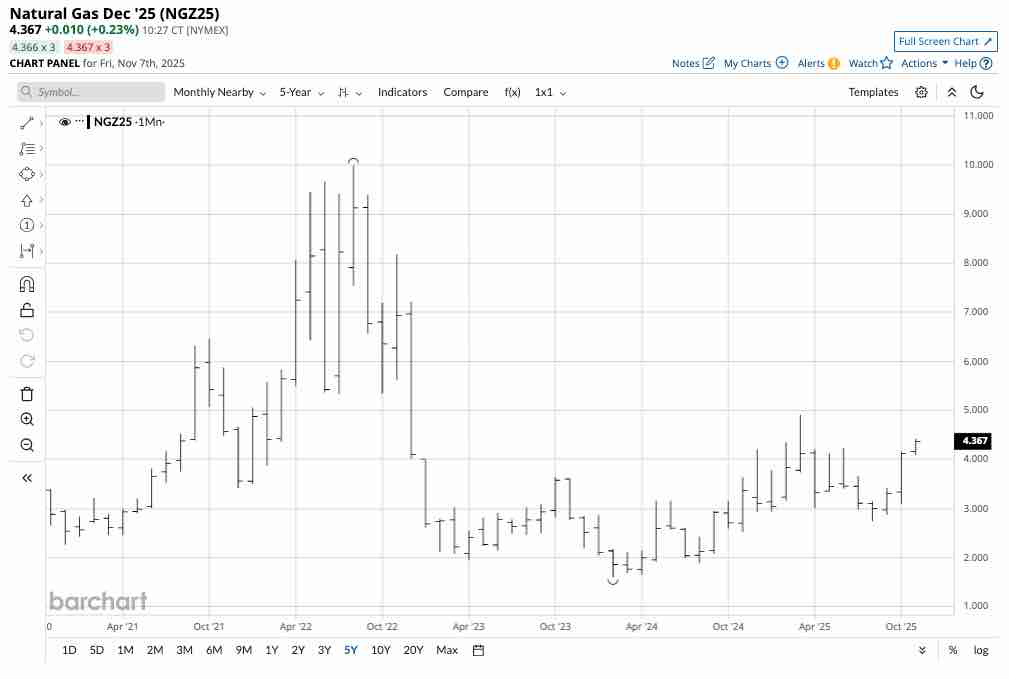
The monthly continuous NYMEX natural gas futures chart indicates that the upside target is at the March 2025 high of $4.908 per MMBtu, which could be a gateway to higher prices if temperatures drop and heating demand increases over the coming weeks and months.
U.S. LNG exports and AI electricity demand could impact prices as the demand vertical grows
While the weather over the coming weeks and months will be the primary factor influencing the path of least resistance for U.S. natural gas futures prices, two other factors could increase demand.
Historically, Europe has imported natural gas from Russia through its extensive pipeline network. However, sanctions on Moscow are tightening as the war in Ukraine continues to rage. The United States is the leading natural gas-producing country, followed by Russia. Technological advances that enable U.S. natural gas to travel by ocean vessel in liquid form have altered the fundamentals of the energy commodity. Before LNG became available for export, U.S. natural gas was only transported by pipeline, limited to the continent. Sanctions will likely increase the demand for U.S. liquified natural gas exports to Western Europe, replacing sanctioned Russian gas.
Meanwhile, another factor that increases the demand side of natural gas’ fundamental equation is the growing demand for power. Natural gas is a critical input in U.S. electricity generation. As power demand is set to dramatically increase, it will put upward pressure on the demand for natural gas and could support the energy commodity’s price.
BOIL and KOLD are leveraged U.S. natural gas ETF products
The most direct route for a risk position in U.S. natural gas is the highly liquid, but highly volatile CME’s NYMEX division futures contracts. Each contract contains 10,000 MMBtus. At $4.37 per MMBtu, the contract value is $43,700. The exchange’s current original margin requirement is 8.3% of the contract value at $3,626. If equity on a long or short position falls below $3,297 per contract, the exchange requires maintenance margin payments.
Meanwhile, the U.S. Natural Gas Fund (UNG) is a highly liquid and unleveraged product. At $14.05 per share, UNG had over $680.8 million in assets under management. UNG trades an average of over 14.35 million shares daily and charges a 1.11% management fee.
The Bloomberg Ultra Natural Gas 2X ETF (BOIL) provides double upside leverage for the already volatile U.S. natural gas price. At $33.02 per share, BOIL had over $651.15 million in assets under management. BOIL trades an average of over 7.8 million shares daily and charges a 0.95% management fee.
The Bloomberg Ultrashort Natural Gas -2X ETF (KOLD) provides double downside leverage for the already volatile U.S. natural gas price. At $29.22 per share, KOLD had over $100 million in assets under management. KOLD trades an average of over 4.675 million shares daily and charges a 0.95% management fee.
Natural gas is already a highly volatile commodity, so the futures and UNG ETF require careful attention to risk-reward dynamics, including price and time stops. Meanwhile, the leveraged bullish BOIL and bearish KOLD ETF products increase the need for risk-reward management as they will lose value if natural gas prices do not move in the anticipated direction or if they remain stable. BOIL and KOLD employ options and swap products that experience time decay that erodes their value.
The natural gas market is transitioning into the season when prices tend to rise as demand for the energy commodity increases during winter. In November, the injections to storage become withdrawals, and the uncertainty of temperatures across the United States often causes price appreciation. I am bullish on the prospects for natural gas prices over the coming weeks, but expect significant price variance. BOIL and KOLD are short-term trading tools that require constant attention to risk-reward dynamics, but they enable market participants to capitalize on the energy commodity’s numerous trading opportunities during the early stages of the peak demand season.
On the date of publication, Andrew Hecht did not have (either directly or indirectly) positions in any of the securities mentioned in this article. All information and data in this article is solely for informational purposes. For more information please view the Barchart Disclosure Policy here.
More news from Barchart