

Medical technology company Stryker (NYSE: SYK) met Wall Streets revenue expectations in Q3 CY2025, with sales up 10.2% year on year to $6.06 billion. Its non-GAAP profit of $3.19 per share was 1.9% above analysts’ consensus estimates.
Is now the time to buy Stryker? Find out by accessing our full research report, it’s free for active Edge members.
Stryker (SYK) Q3 CY2025 Highlights:
- Revenue: $6.06 billion vs analyst estimates of $6.03 billion (10.2% year-on-year growth, in line)
- Adjusted EPS: $3.19 vs analyst estimates of $3.13 (1.9% beat)
- Management slightly raised its full-year Adjusted EPS guidance to $13.55 at the midpoint
- Operating Margin: 18.7%, down from 19.7% in the same quarter last year
- Free Cash Flow Margin: 22.3%, down from 23.7% in the same quarter last year
- Organic Revenue rose 9.5% year on year vs analyst estimates of 9% growth (46.7 basis point beat)
- Market Capitalization: $141.3 billion
“We delivered another quarter of strong sales and double-digit adjusted earnings per share growth,” said Kevin A. Lobo, Chair and CEO.
Company Overview
With over 150 million patients impacted annually through its innovative healthcare technologies, Stryker (NYSE: SYK) develops and manufactures advanced medical devices and equipment across orthopedics, surgical tools, neurotechnology, and patient care solutions.
Revenue Growth
A company’s long-term performance is an indicator of its overall quality. Any business can have short-term success, but a top-tier one grows for years. Luckily, Stryker’s sales grew at a decent 11.4% compounded annual growth rate over the last five years. Its growth was slightly above the average healthcare company and shows its offerings resonate with customers.
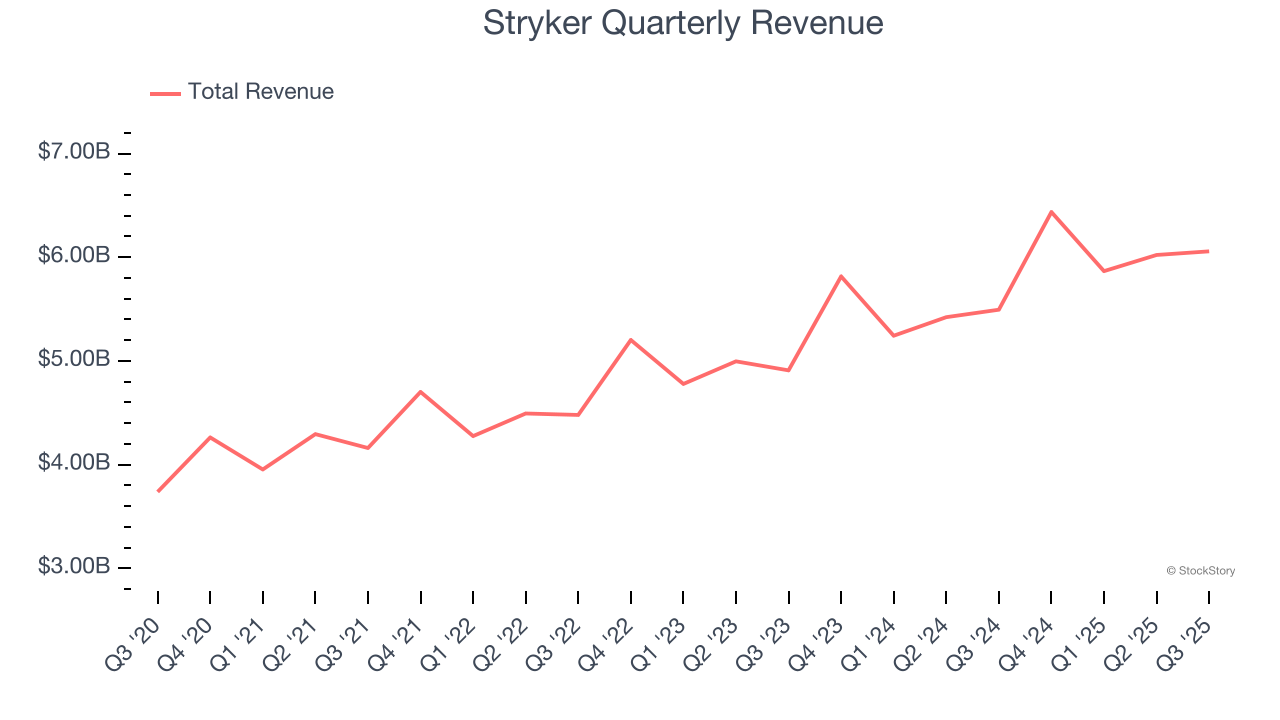
We at StockStory place the most emphasis on long-term growth, but within healthcare, a half-decade historical view may miss recent innovations or disruptive industry trends. Stryker’s annualized revenue growth of 10.7% over the last two years aligns with its five-year trend, suggesting its demand was stable. 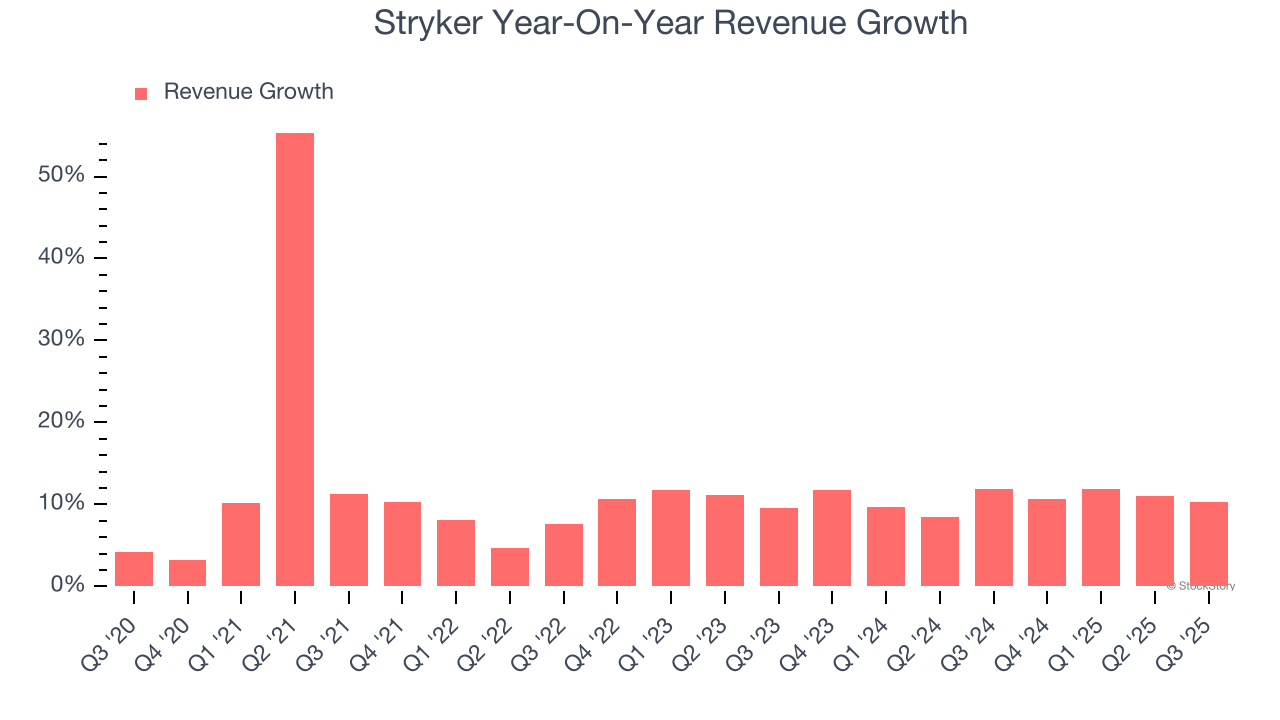
Stryker also reports organic revenue, which strips out one-time events like acquisitions and currency fluctuations that don’t accurately reflect its fundamentals. Over the last two years, Stryker’s organic revenue averaged 10.2% year-on-year growth. Because this number aligns with its two-year revenue growth, we can see the company’s core operations (not acquisitions and divestitures) drove most of its results. 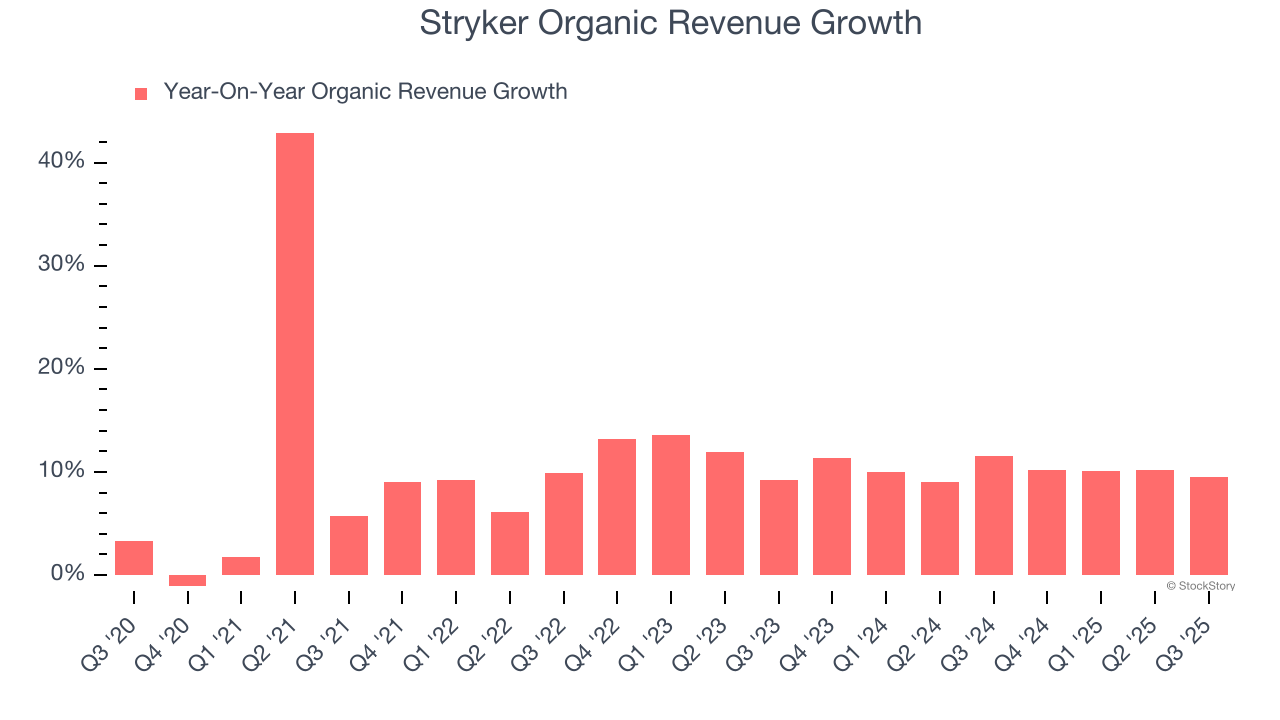
This quarter, Stryker’s year-on-year revenue growth was 10.2%, and its $6.06 billion of revenue was in line with Wall Street’s estimates.
Looking ahead, sell-side analysts expect revenue to grow 8.6% over the next 12 months, a slight deceleration versus the last two years. We still think its growth trajectory is attractive given its scale and indicates the market is forecasting success for its products and services.
Here at StockStory, we certainly understand the potential of thematic investing. Diverse winners from Microsoft (MSFT) to Alphabet (GOOG), Coca-Cola (KO) to Monster Beverage (MNST) could all have been identified as promising growth stories with a megatrend driving the growth. So, in that spirit, we’ve identified a relatively under-the-radar profitable growth stock benefiting from the rise of AI, available to you FREE via this link.
Operating Margin
Stryker’s operating margin might fluctuated slightly over the last 12 months but has remained more or less the same, averaging 16.7% over the last five years. This profitability was solid for a healthcare business and shows it’s an efficient company that manages its expenses well.
Looking at the trend in its profitability, Stryker’s operating margin of 15% for the trailing 12 months may be around the same as five years ago, but it has decreased by 2.3 percentage points over the last two years. Still, we’re optimistic that Stryker can correct course and expand its profitability on a longer-term horizon due to its business quality.
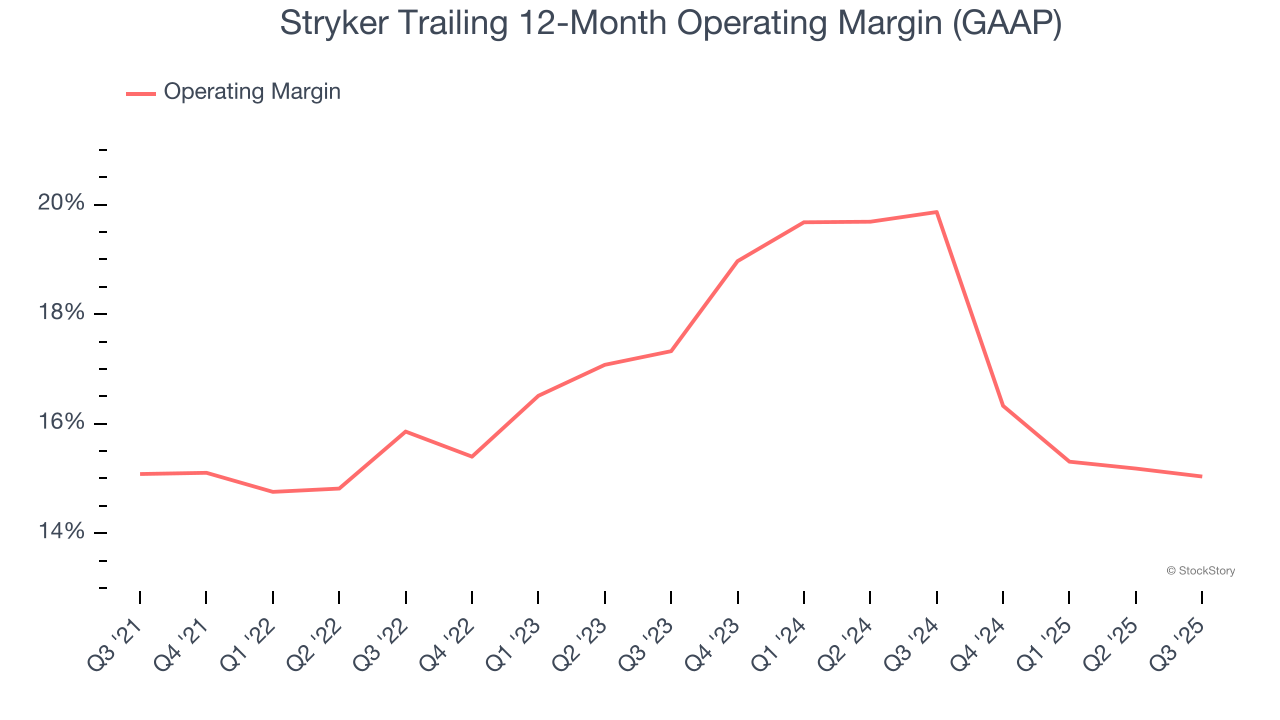
In Q3, Stryker generated an operating margin profit margin of 18.7%, down 1 percentage points year on year. This reduction is quite minuscule and indicates the company’s overall cost structure has been relatively stable.
Earnings Per Share
Revenue trends explain a company’s historical growth, but the long-term change in earnings per share (EPS) points to the profitability of that growth – for example, a company could inflate its sales through excessive spending on advertising and promotions.
Stryker’s spectacular 13.1% annual EPS growth over the last five years aligns with its revenue performance. This tells us it maintained its per-share profitability as it expanded.
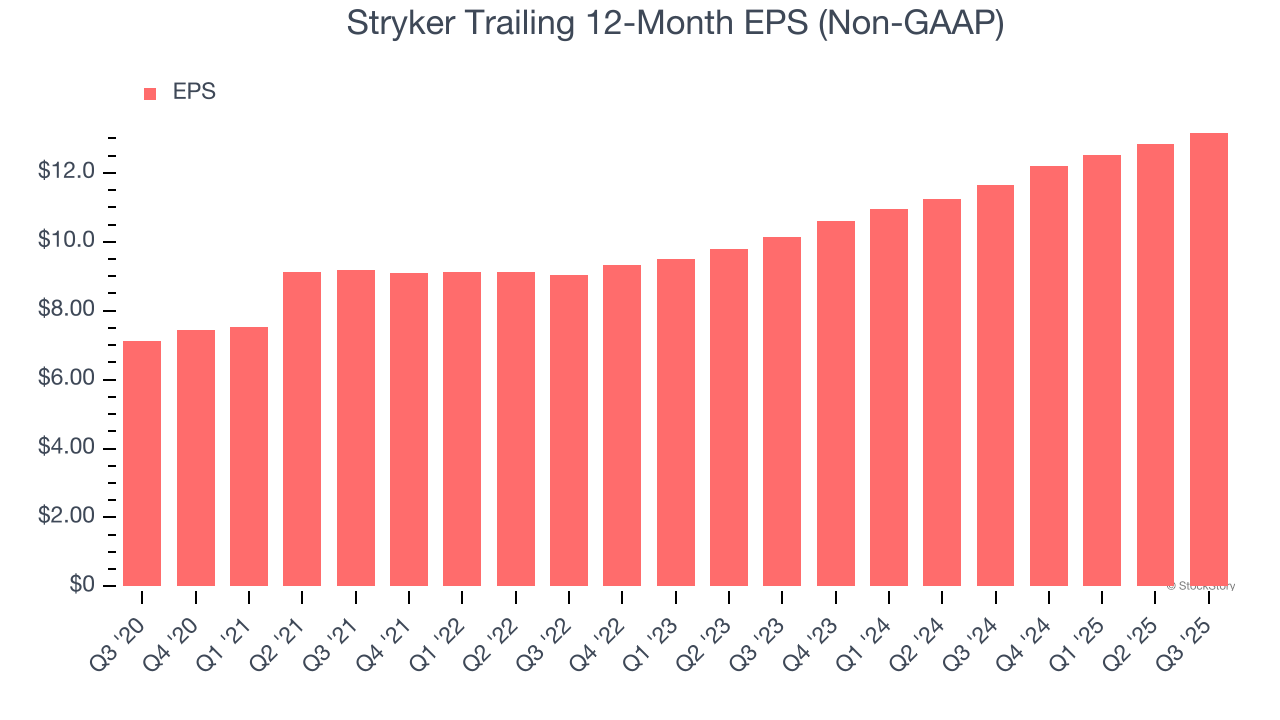
In Q3, Stryker reported adjusted EPS of $3.19, up from $2.87 in the same quarter last year. This print beat analysts’ estimates by 1.9%. Over the next 12 months, Wall Street expects Stryker’s full-year EPS of $13.17 to grow 10.2%.
Key Takeaways from Stryker’s Q3 Results
It was good to see Stryker meet analysts’ organic revenue expectations this quarter, although revenue was just in line. EPS managed to exceed expectations though. Overall, this print had some key positives. The market seemed to be hoping for more, and the stock traded down 1.1% to $364.89 immediately after reporting.
Is Stryker an attractive investment opportunity right now? What happened in the latest quarter matters, but not as much as longer-term business quality and valuation, when deciding whether to invest in this stock. We cover that in our actionable full research report which you can read here, it’s free for active Edge members.


