Although the energy sector has generally struggled this year, Valero Energy (VLO) has been one of the clear outliers. As the largest independent refiner and marketer of petroleum products, Valero appears to have benefited from a more focused operational footprint. Since the start of the year, VLO stock has gained nearly 33% of market value. Combined with the Trump administration’s positive stance on fossil fuels, the business appears to be on solid footing.
Still, equities sentiment is often patchy and VLO stock has recently been caught under a weak spell. In the trailing five sessions, the security slipped more than 2%. In the past month, it’s down about 5%. Nevertheless, sentiment may be improving, as evidenced by shifting winds in the derivatives market.
Throughout most of this month, options flow — which focuses on big block transactions likely placed by institutional investors — has been quite pessimistic, with net trade sentiment falling firmly into negative territory over several sessions. Even more problematic, many of these transactions were debit-based puts, implying a downward directional bias.
Fortunately for the bulls, the icy sentiment more recently appears to be thawing. Steadily, more traders have been buying calls last week, potentially indicating a shift in outlook among the smart money. While unusual options data must be taken with a grain of salt considering the myriad transactions and complexities, they can sometimes tip off larger moves in the open market.
Last week, I discussed the contrarian case of one of the most popular data center stocks. While my argument hinged on quantitative analysis, I did note that net trade sentiment in that security’s options flow screener showed bullish sentiment despite huge sell-offs in the open market.
With VLO stock, my observation is that options flow data was initially net negative for most of this month. However, with sentiment gradually turning around, the open market may soon follow suit.
VLO Stock Flashes an Unusual Quant Signal
In order to be a more effective trader, it’s important not to merely focus on where the target security may go. Rather, a true analysis should reveal the breaking point — the threshold where the bulls can no longer justify their optimism and become sellers of exuberance.
If there’s any one adage to hold onto in capitalism, it’s that everyone has a price. If you find out what it is, you suddenly expose the true risk geometry of the security you’re covering. Still, this raises the obvious question: how do you go about finding this transitional fulcrum?
Essentially, we need to rethink the entire framework of the market from event-based, chronological speculation to a fixed-time distributional paradigm. If you took a single 10-week cycle of VLO stock, the return during this period would not tell you anything about the performance probability of the other weeks in the dataset. However, if we took hundreds of rolling 10-week cycles, the most frequent, consistent behaviors would create bulges in probabilistic mass.
These bulges represent the point of highest probability density — and taken together, they represent risk geometry.

For example, the 10-week distributions of VLO stock (going back to January 2019) would likely range between $161 and $168.50 (assuming an anchor price or starting point of $162.71, Friday’s close). Further, price clustering would likely be predominant at around $163.80.
However, we’re interested in isolating for the current quant signal, which is the 4-6-U; that is, in the past 10 weeks, VLO stock only printed four up weeks. However, the overall slope was upward, meaning that even though the bears outnumbered the bulls, the net price activity during the 10-week period was positive.
Under this setup, the forward 10-week returns would likely range between $152 and $193, with price clustering likely to occur around $174. This translates to a positive variance of 6.23% between the two clusters, which represents a structural arbitrage.
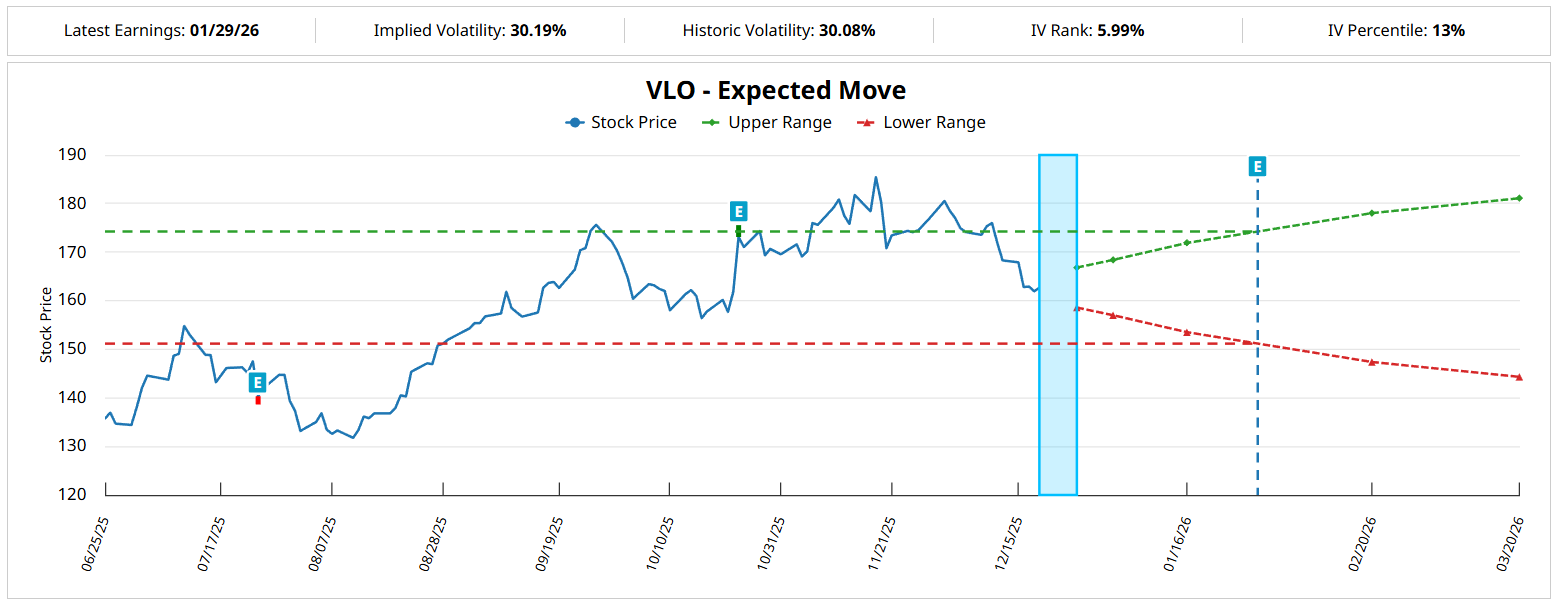
Essentially, most of the market — based on the Expected Move calculator — is targeting a plus-minus dispersion of 9.42%. However, our distributional analysis reveals 6.94% directional coalescing of pricing behavior over the next 10 weeks.
We’re going to use this insight to our advantage.
Intriguing Propositions on the Table
While Valero might not elicit great excitement among open-market investors, it’s a beautiful sight to behold for options traders, especially those considering vertical spreads. Based on the above market intel, the one trade that stands out is the 170/175 bull call spread expiring Feb. 20, 2026.

For those intrigued by the opportunity, the wager involves buying the $170 call and simultaneously selling the $175 call on a single execution. Overall, the net debit paid is $205, which is the most that can be lost. Should VLO stock rise through the second-leg strike ($175) at expiration, the maximum profit is $295, translating to a payout of nearly 144%.
However, the most enticing idea in my opinion is the 175/180 bull spread, also expiring Feb. 20. Here, VLO stock must rise through a much higher target. Nevertheless, the relative penalty of probability decay is not that steep compared to the likelihood of the security reaching $175.
In other words, the risk geometry of VLO stock shows that there’s still a solid chance that the security hits $180 over the next 10 weeks. It’s only after the $180 mark that probability decay accelerates exponentially.
Plus, the maximum payout of over 218% is going to make a lot of people think hard.
On the date of publication, Josh Enomoto did not have (either directly or indirectly) positions in any of the securities mentioned in this article. All information and data in this article is solely for informational purposes. For more information please view the Barchart Disclosure Policy here.
More news from Barchart