On paper, Dollar Tree (DLTR) should thrive under the current economic malaise. Due to everyday consumers being under significant pressure, discount specialists tend to benefit from the trade down effect — the concept that shoppers will trade for lower quality in exchange for a lower price. Frankly, it doesn’t get much lower in the price scale than Dollar Tree, which theoretically makes DLTR stock appealing.
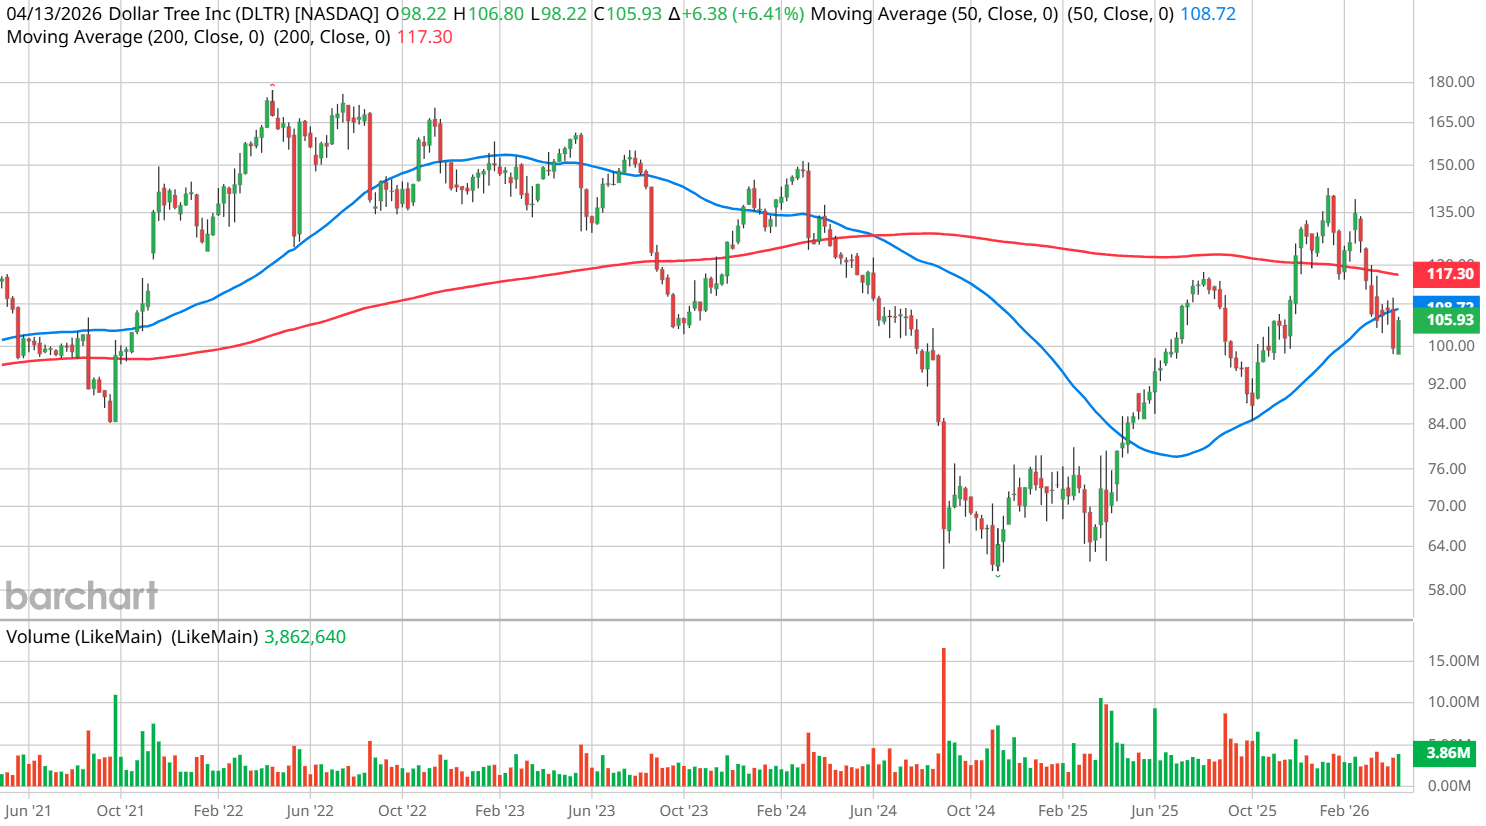
However, this narrative really hasn’t panned out. On a year-to-date basis, DLTR stock is down nearly 14%. Since closing at a multi-year peak in mid-January of this year, the security has shed 25% of value. Unsurprisingly, DLTR has incurred a 40% Sell rating from the Barchart Technical Opinion indicator, reflecting the ticker falling below key moving averages.
Still, it’s not out of the question that DLTR stock could enjoy a reversion-to-the-mean play. Recently, the security popped sharply higher due to some encouraging news on the Iran front (though the latest news stream suggests headwinds could be brewing again). It’s also possible that value-seeking investors may see opportunity in the discount retailer.
But even on a fundamental level, there are challenges that DLTR stock must overcome. One of them — which really has nothing to do with Iran or the economic conditions per se — is the company’s multi-price product strategy. For decades, Dollar Tree lived up exactly to its name: everything cost a buck. A couple years ago, management moved this universal baseline to $1.25.
Currently, Dollar Tree has introduced items on its shelves that range between $3 to $7. From a financial perspective, the move is designed to accommodate a higher-quality product mix and to attract a wider segment of the consumer demographic. But this decision also pivots the business away from a pure dollar store — which its long-held image is tied to — to another realm of mixed-price discount specialists.
Since these other specialists have arguably already established a strong foothold in the arena that Dollar Tree seeks to disrupt, DLTR may face an uphill battle despite any encouraging news on the geopolitical front.
Deciphering a Path Forward for DLTR Stock Using Inductive Math
Recently, I was reading market opinions on Dollar Tree stock in the blogosphere and I came across a “predictive AI”-driven entry. This analysis featured three price targets: a bullish target of $114.84, an extra-bullish target of $122.55 and a hedging/short target of $101.01.
Based on the information from the article, it’s not possible to decipher how these price targets for DLTR stock were manifested. It does seem from observation that the targets came from AI-generated technical analysis. However, the more important question was left up to the reader to decide: which one of these forecasted figures is the most likely to be accurate?
Strategically, providing a range of outcomes without assigning specific probabilities to them technically means you can’t be proven wrong — however, it doesn’t really help the reader in terms of a decision-point analysis. So, I’m going to go out on a limb and say that, over the next few months, the $101 target may be more realistic.
How am I coming to this opinion? Basically, we can use mathematical induction to attempt to figure out what may happen in the future. Specifically, I’d like to look at the last 10 weeks (going back to January 2019) to find out what may happen in the next 10 weeks.
As an aggregate, a 10-week long position (using Friday’s closing price of $105.93 as a starting point) should see DLTR stock range between $104 and $107.50. This statistic comes from aggregating 361 rolling 10-week sequences. Notably, though, the difficulty for the bulls is that 177 of these sequences ended up below the aforementioned spot price. In other words, the exceedance ratio under aggregate conditions was only 49% (at the end of 10 weeks).
Critically, in the past 10 weeks, DLTR stock has only printed three up weeks, leading to an overall downward slope. I theorize that the forward 10-week distribution under this specific condition is different from the aggregate — and that’s exactly the case. Using $105.93 as the starting point, we would expect DLTR to range between $95 and $112 over the next 10 weeks.
Strikingly, the exceedance ratio under this bearish signal is 34.6%. Yes, we’re talking about a much smaller sample size than the aggregate — but for whatever reason, traders tend not to buy the dip in DLTR stock.
A Bear Put Spread for the Extreme Contrarian
I’ll be the first to admit that induction has its clear limitations. Primarily, we have the black swan problem. Just because you see a thousand white swans doesn’t mean all swans are white. Once a black swan appears, that presumed absoluteness of that inductive calculation gets blown up.
However, induction can’t be outright ignored because all forecasts of the unknown future are necessarily inductive. After all, nothing logically compels the market to respond absolutely to a particular signal. And so far, the data shows that there is really no consistently positive correlation between a sharply discounted DLTR stock price and an elevated long-side opportunity.
With that said, if you do want to take a calculated risk, you may consider the 105/100 bear put spread expiring June 18. This trade is aiming for DLTR stock to fall through the $100 strike at expiration. If it does, the maximum payout is 100%. Breakeven lands at $102.50, somewhat improving the margin of profitability.
On the date of publication, Josh Enomoto did not have (either directly or indirectly) positions in any of the securities mentioned in this article. All information and data in this article is solely for informational purposes. For more information please view the Barchart Disclosure Policy here.


