Manufacturing company Leggett & Platt (NYSE: LEG) met Wall Street’s revenue expectations in Q1 CY2025, but sales fell by 6.8% year on year to $1.02 billion. On the other hand, the company’s full-year revenue guidance of $4.15 billion at the midpoint came in 0.6% below analysts’ estimates. Its non-GAAP profit of $0.24 per share was 10.3% above analysts’ consensus estimates.
Is now the time to buy Leggett & Platt? Find out by accessing our full research report, it’s free.
Leggett & Platt (LEG) Q1 CY2025 Highlights:
- Revenue: $1.02 billion vs analyst estimates of $1.02 billion (6.8% year-on-year decline, in line)
- Adjusted EPS: $0.24 vs analyst estimates of $0.22 (10.3% beat)
- Adjusted EBITDA: $98.2 million vs analyst estimates of $93.4 million (9.6% margin, 5.1% beat)
- The company reconfirmed its revenue guidance for the full year of $4.15 billion at the midpoint
- Management reiterated its full-year Adjusted EPS guidance of $1.10 at the midpoint
- Operating Margin: 6.2%, in line with the same quarter last year
- Free Cash Flow was -$6.5 million compared to -$32 million in the same quarter last year
- Market Capitalization: $983.8 million
President and CEO Karl Glassman commented, "We are pleased to report better than anticipated first quarter earnings. Our earnings improvement is a testament to the excellent execution of our restructuring plan and operational efficiency improvement initiatives, as well as disciplined cost management. As we navigate the complex and fluid tariff environment, we are mitigating impacts while pursuing any opportunities to capture increased demand for domestically produced products. While we expect that tariffs overall may be a net positive for our business, we are concerned about potential negative effects on inflation, consumer confidence, and discretionary demand.
Company Overview
Founded in 1883, Leggett & Platt (NYSE: LEG) is a diversified manufacturer of products and components for various industries.
Sales Growth
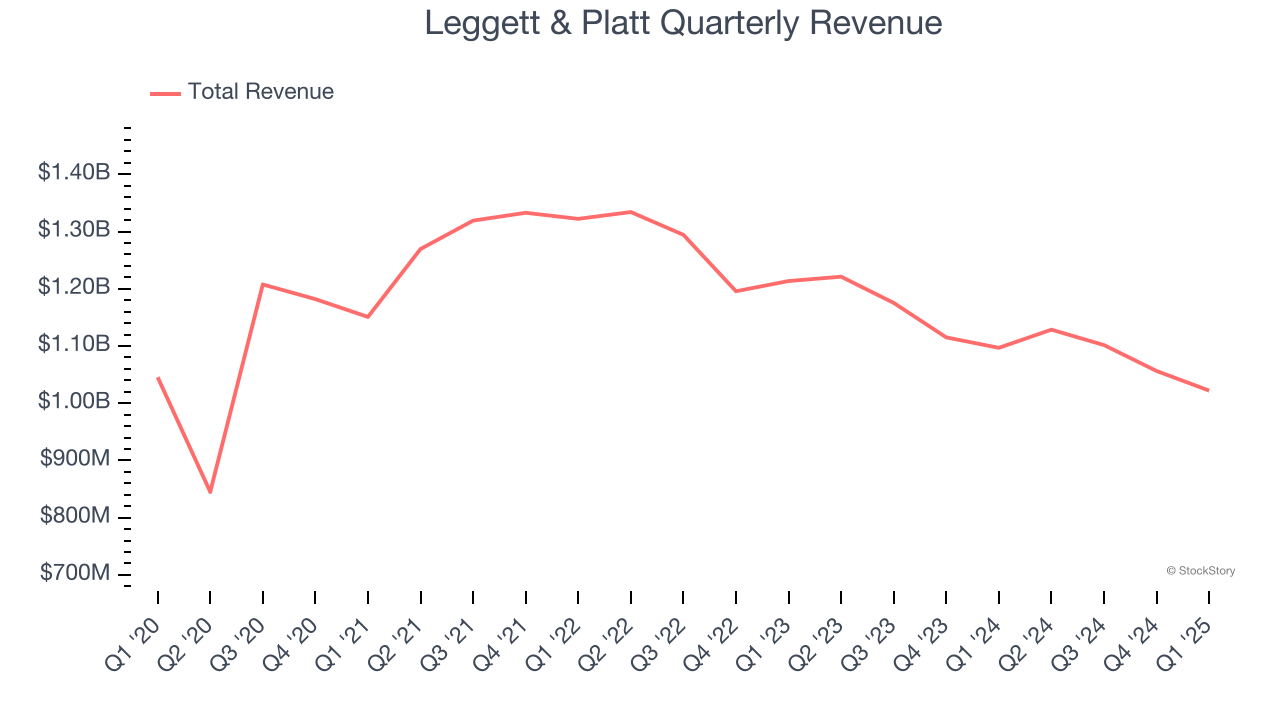
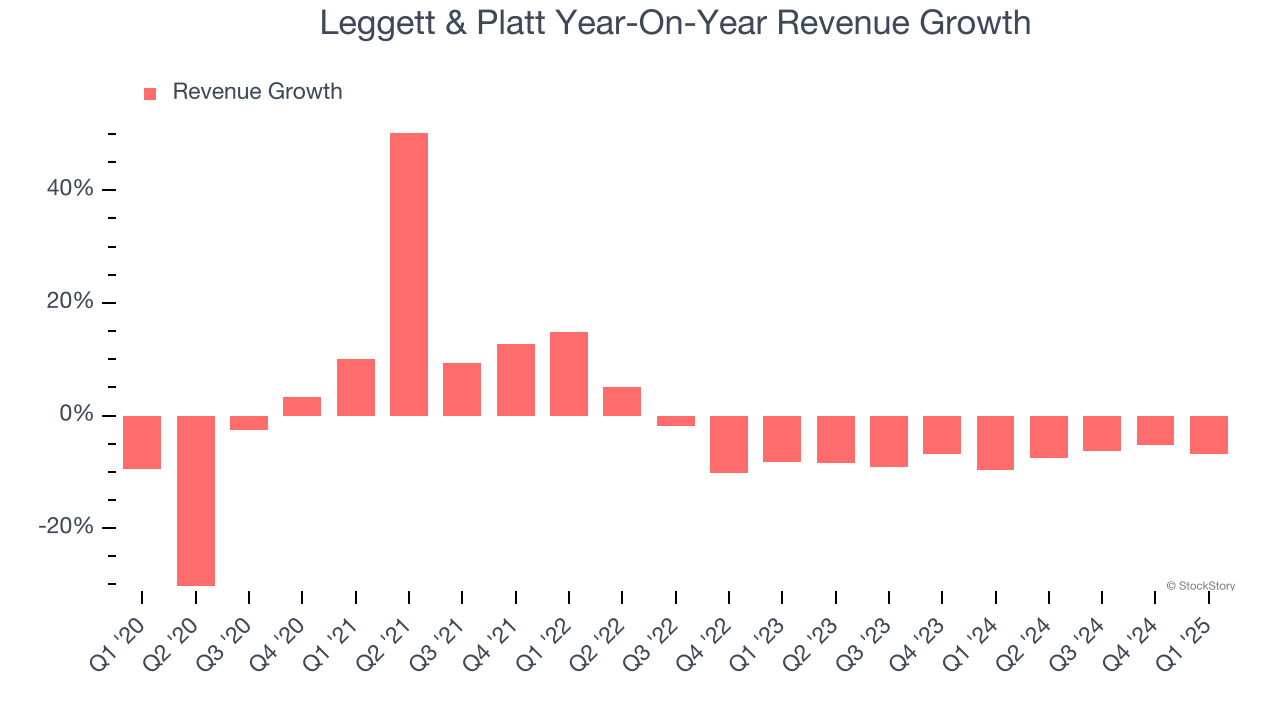
A company’s long-term sales performance is one signal of its overall quality. Even a bad business can shine for one or two quarters, but a top-tier one grows for years. Leggett & Platt struggled to consistently generate demand over the last five years as its sales dropped at a 1.5% annual rate. This wasn’t a great result and is a sign of poor business quality.

We at StockStory place the most emphasis on long-term growth, but within consumer discretionary, a stretched historical view may miss a company riding a successful new product or trend. Leggett & Platt’s recent performance shows its demand remained suppressed as its revenue has declined by 7.5% annually over the last two years. 
We can better understand the company’s revenue dynamics by analyzing its three most important segments: Bedding, FF&T, and Specialized Products, which are 38.2%, 32.4%, and 29.4% of revenue. Over the last two years, Leggett & Platt’s Bedding (mattresses and foundations) and FF&T (sofa parts and tiles ) revenues averaged year-on-year declines of 13% and 7% while its Specialized Products revenue (automobile components) averaged 2.6% growth.
This quarter, Leggett & Platt reported a rather uninspiring 6.8% year-on-year revenue decline to $1.02 billion of revenue, in line with Wall Street’s estimates.
Looking ahead, sell-side analysts expect revenue to decline by 3% over the next 12 months. Although this projection is better than its two-year trend, it's tough to feel optimistic about a company facing demand difficulties.
Unless you’ve been living under a rock, it should be obvious by now that generative AI is going to have a huge impact on how large corporations do business. While Nvidia and AMD are trading close to all-time highs, we prefer a lesser-known (but still profitable) stock benefiting from the rise of AI. Click here to access our free report one of our favorites growth stories.
Operating Margin
Operating margin is an important measure of profitability as it shows the portion of revenue left after accounting for all core expenses – everything from the cost of goods sold to advertising and wages. It’s also useful for comparing profitability across companies with different levels of debt and tax rates because it excludes interest and taxes.
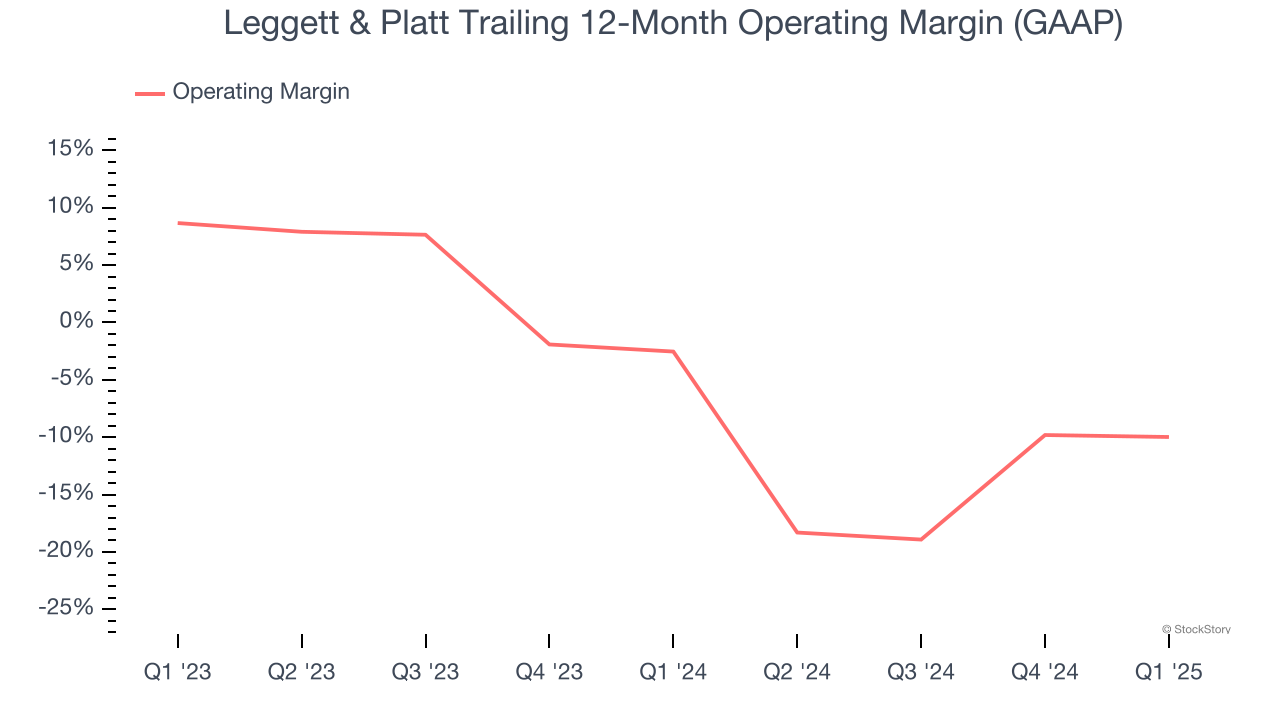
Leggett & Platt’s operating margin has been trending down over the last 12 months and averaged negative 6.1% over the last two years. Unprofitable consumer discretionary companies with falling margins deserve extra scrutiny because they’re spending loads of money to stay relevant, an unsustainable practice.

This quarter, Leggett & Platt generated an operating profit margin of 6.2%, in line with the same quarter last year. This indicates the company’s overall cost structure has been relatively stable.
Earnings Per Share
We track the long-term change in earnings per share (EPS) for the same reason as long-term revenue growth. Compared to revenue, however, EPS highlights whether a company’s growth is profitable.
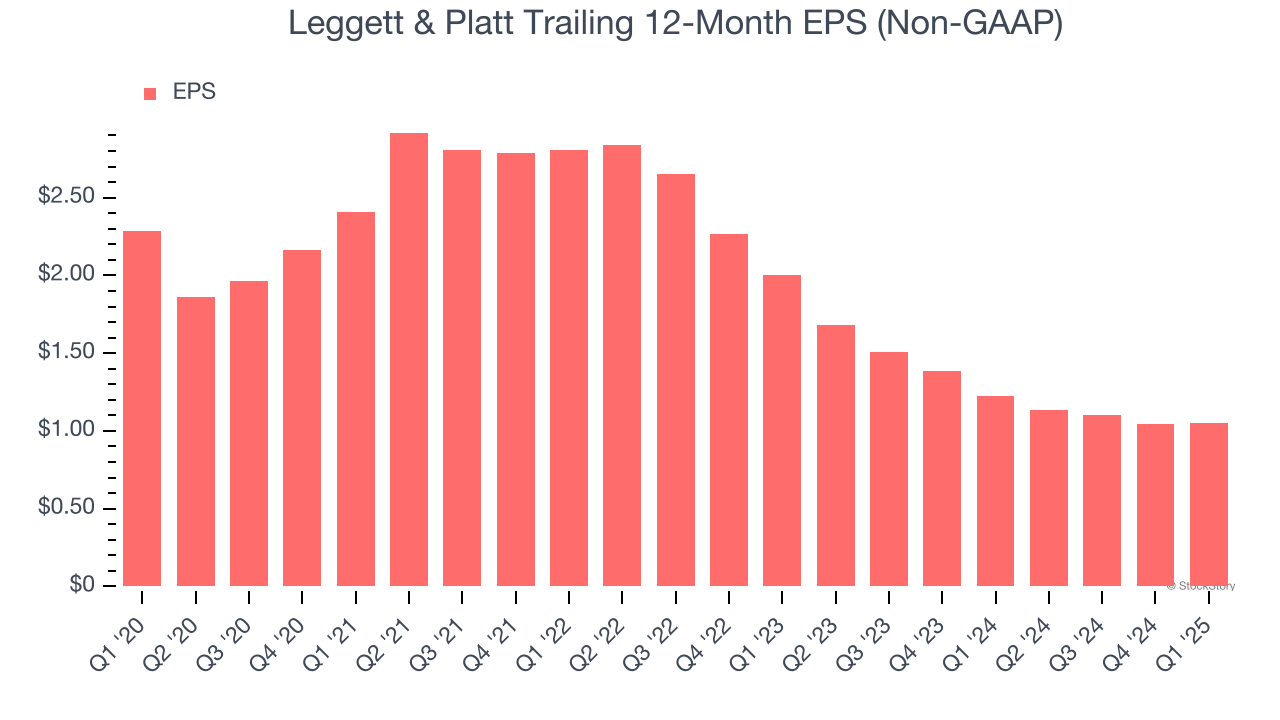
Sadly for Leggett & Platt, its EPS declined by 14.4% annually over the last five years, more than its revenue. This tells us the company struggled because its fixed cost base made it difficult to adjust to shrinking demand.

In Q1, Leggett & Platt reported EPS at $0.24, in line with the same quarter last year. This print easily cleared analysts’ estimates, and shareholders should be content with the results. Over the next 12 months, Wall Street expects Leggett & Platt’s full-year EPS of $1.05 to grow 4.2%.
Key Takeaways from Leggett & Platt’s Q1 Results
It was encouraging to see Leggett & Platt beat analysts’ EPS expectations this quarter. We were also glad its full-year EPS guidance exceeded Wall Street’s estimates. On the other hand, its FF&T revenue missed and its full-year revenue guidance fell slightly short of Wall Street’s estimates. Overall, this quarter was mixed, but considering low expectations, this was a good quarter. The stock traded up 12% to $8.13 immediately after reporting.
Is Leggett & Platt an attractive investment opportunity at the current price? What happened in the latest quarter matters, but not as much as longer-term business quality and valuation, when deciding whether to invest in this stock. We cover that in our actionable full research report which you can read here, it’s free.
