
S&P Global currently trades at $491.52 per share and has shown little upside over the past six months, posting a small loss of 4.1%. The stock also fell short of the S&P 500’s 14.1% gain during that period.
Is now the time to buy SPGI? Find out in our full research report, it’s free for active Edge members.
Why Are We Positive On S&P Global?
Tracing its roots back to 1860 when it published the first railroad industry manual, S&P Global (NYSE: SPGI) provides credit ratings, market intelligence, commodity data, automotive analytics, and financial indices that help investors and businesses make decisions.
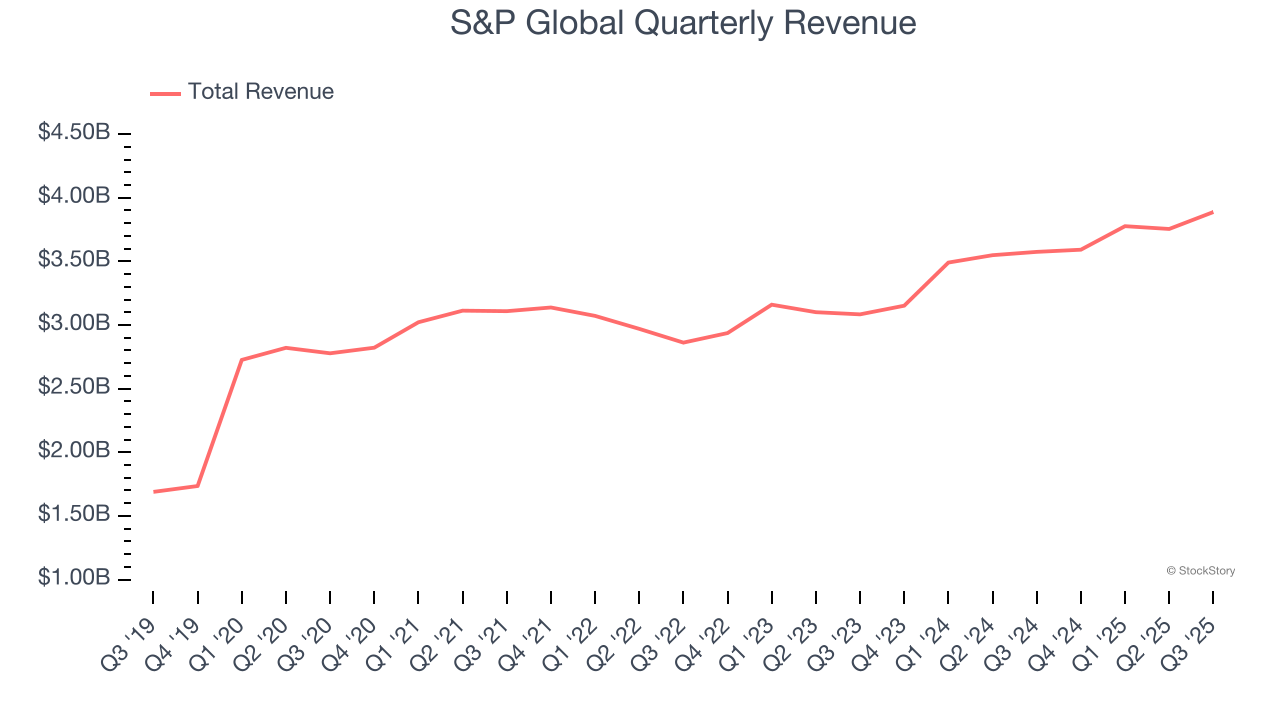
1. Long-Term Revenue Growth Shows Momentum
A company’s long-term sales performance can indicate its overall quality. Even a bad business can shine for one or two quarters, but a top-tier one grows for years.
Thankfully, S&P Global’s 8.3% annualized revenue growth over the last five years was decent. Its growth was slightly above the average financials company and shows its offerings resonate with customers.
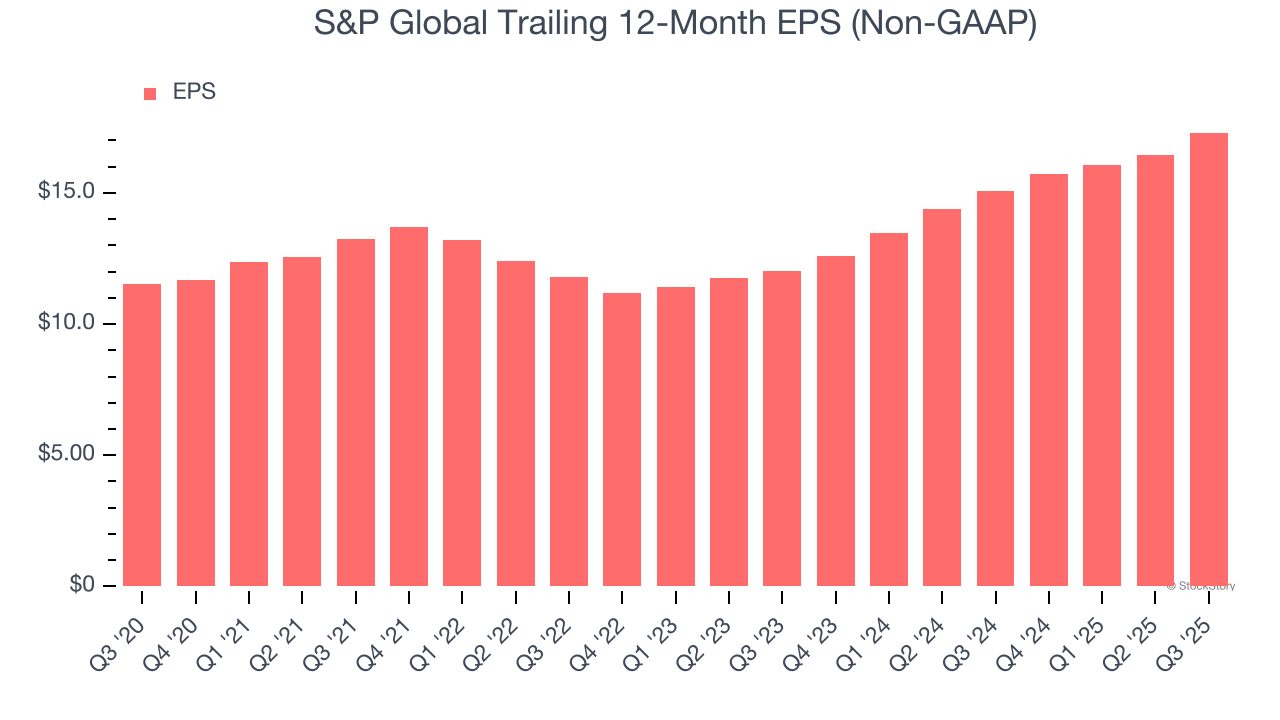
2. EPS Surges Higher Over the Last Two Years
Although long-term earnings trends give us the big picture, we like to analyze EPS over a shorter period to see if we are missing a change in the business.
S&P Global’s EPS grew at a remarkable 20% compounded annual growth rate over the last two years, higher than its 10.6% annualized revenue growth. This tells us the company became more profitable on a per-share basis as it expanded.
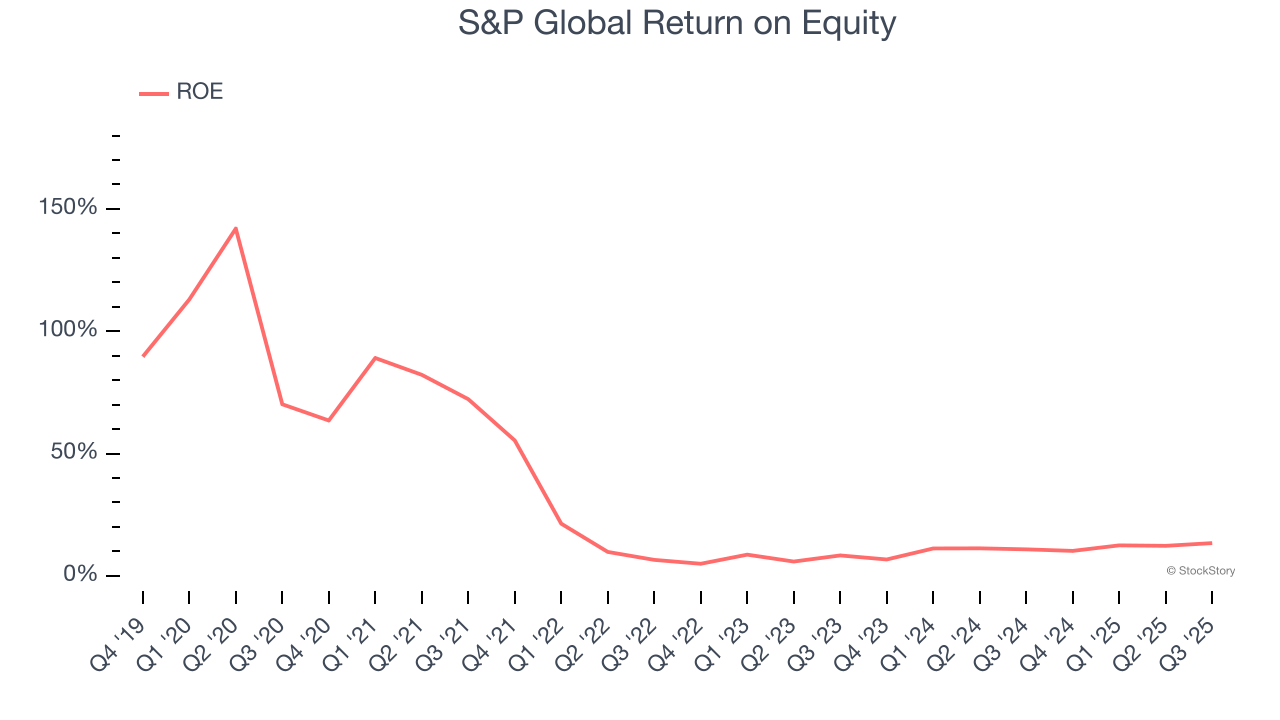
3. Stellar ROE Showcases Lucrative Growth Opportunities
Return on equity (ROE) reveals the profit generated per dollar of shareholder equity, which represents a key source of bank funding. Banks maintaining elevated ROE levels tend to accelerate wealth creation for shareholders via earnings retention, buybacks, and distributions.
Over the last five years, S&P Global has averaged an ROE of 25.8%, exceptional for a company operating in a sector where the average shakes out around 10% and those putting up 25%+ are greatly admired. This shows S&P Global has a strong competitive moat.
Final Judgment
These are just a few reasons why we think S&P Global is a great business. With its shares lagging the market recently, the stock trades at 25.7× forward P/E (or $491.52 per share). Is now a good time to buy? See for yourself in our full research report, it’s free for active Edge members.
Stocks We Like Even More Than S&P Global
The market’s up big this year - but there’s a catch. Just 4 stocks account for half the S&P 500’s entire gain. That kind of concentration makes investors nervous, and for good reason. While everyone piles into the same crowded names, smart investors are hunting quality where no one’s looking - and paying a fraction of the price. Check out the high-quality names we’ve flagged in our Top 9 Market-Beating Stocks. This is a curated list of our High Quality stocks that have generated a market-beating return of 244% over the last five years (as of June 30, 2025).
Stocks that have made our list include now familiar names such as Nvidia (+1,326% between June 2020 and June 2025) as well as under-the-radar businesses like the once-small-cap company Exlservice (+354% five-year return). Find your next big winner with StockStory today.
StockStory is growing and hiring equity analyst and marketing roles. Are you a 0 to 1 builder passionate about the markets and AI? See the open roles here.


