Tesla, Inc. (NQ:TSLA)
Price and Volume
Detailed Quote| Volume | 34,762,968 |
| Open | 373.20 |
| Bid (Size) | 372.10 (40) |
| Ask (Size) | 372.45 (240) |
| Prev. Close | 374.58 |
| Today's Range | 365.27 - 377.32 |
| 52wk Range | 297.38 - 498.83 |
| Shares Outstanding | 3,216,517,037 |
| Dividend Yield | N/A |
Top News
More News

Performance
52-Week Range
25.4% below 52-week high
372.22
297.3852W Low
498.8352W High
1 Week
4.3% below 1-week high
354.471W Low
388.861W High
Tesla, Inc. (TSLA) traded between $297.38 and $498.83 over the past 52 weeks and last traded at $372.22, 25.4% below its 52-week high. Over the past week it ranged between $354.47 and $388.86.
Past 12 Months
1W
+$4.16
1M
-$7.90
3M
+$59.19
6M
-$4.08
YTD
-$65.85
1Y
-$76.76
TSLA was -17.1% over the past year, -1.1% over six months, -15.0% year to date, +1.1% in the last week.
12 Months vs Market
TSLA
-17.1%
DIA
+11.6%
SPY
+13.1%
QQQ
+15.4%
IWM
+11.9%
Over the past 12 months TSLA returned -17.1% versus DIA (Dow) +11.6%, SPY (S&P 500) +13.1%, QQQ (Nasdaq 100) +15.4% and IWM (Russell 2000) +11.9%.
Volume & Liquidity
0.94× 3-mo avg
Today 34,762,968
3-mo avg 37.1M
1W
41.1M
1M
36.1M
3M
37.1M
6M
42.6M
YTD
50.5M
1Y
56.3M
TSLA most recently traded 34,762,968 shares against a 3-month average daily volume of 37.1M.
More News
Read More
MarketBeat Week in Review – 10/19 - 10/23 ↗
Today 7:00 EDT



Prediction: Nvidia Will Outperform Broadcom Over the Next 5 Years ↗
October 23, 2026

Why Visteon (VC) stock is falling today
October 23, 2026




Finding Rule Breakers, IRL Investing, and Making Mistakes ↗
October 23, 2026



Could a $10,000 Investment in Micron Set You Up for Life? ↗
October 23, 2026

Is 2027 the Turnaround Year for These 4 EV and Air Taxi Stocks? ↗
October 23, 2026


Cathie Wood Just Bought Netflix Stock. Should You Follow Her? ↗
October 22, 2026

Why a Merger With Tesla Could Be a Disaster for SpaceX ↗
October 22, 2026

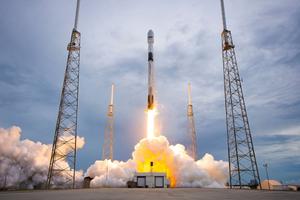
Why SpaceX Stock Dropped on Thursday ↗
October 22, 2026


Tesla’s Flying-Car Hype Hits an Earnings Reality Check ↗
October 22, 2026
Frequently Asked Questions
Is Tesla, Inc. publicly traded?
Yes, Tesla, Inc. is publicly traded.
What exchange does Tesla, Inc. trade on?
Tesla, Inc. trades on the Nasdaq Stock Market
What is the ticker symbol for Tesla, Inc.?
The ticker symbol for Tesla, Inc. is TSLA on the Nasdaq Stock Market
What is the current price of Tesla, Inc.?
The current price of Tesla, Inc. is 372.22
When was Tesla, Inc. last traded?
The last trade of Tesla, Inc. was at 10/23/26 04:00 PM ET
What is the market capitalization of Tesla, Inc.?
The market capitalization of Tesla, Inc. is 1,197.25B
How many shares of Tesla, Inc. are outstanding?
Tesla, Inc. has 1,197B shares outstanding.
Stock Quote API & Stock News API supplied by www.cloudquote.io
Quotes delayed at least 20 minutes.
By accessing this page, you agree to the Privacy Policy and Terms Of Service.
Quotes delayed at least 20 minutes.
By accessing this page, you agree to the Privacy Policy and Terms Of Service.
© 2025 FinancialContent. All rights reserved.