
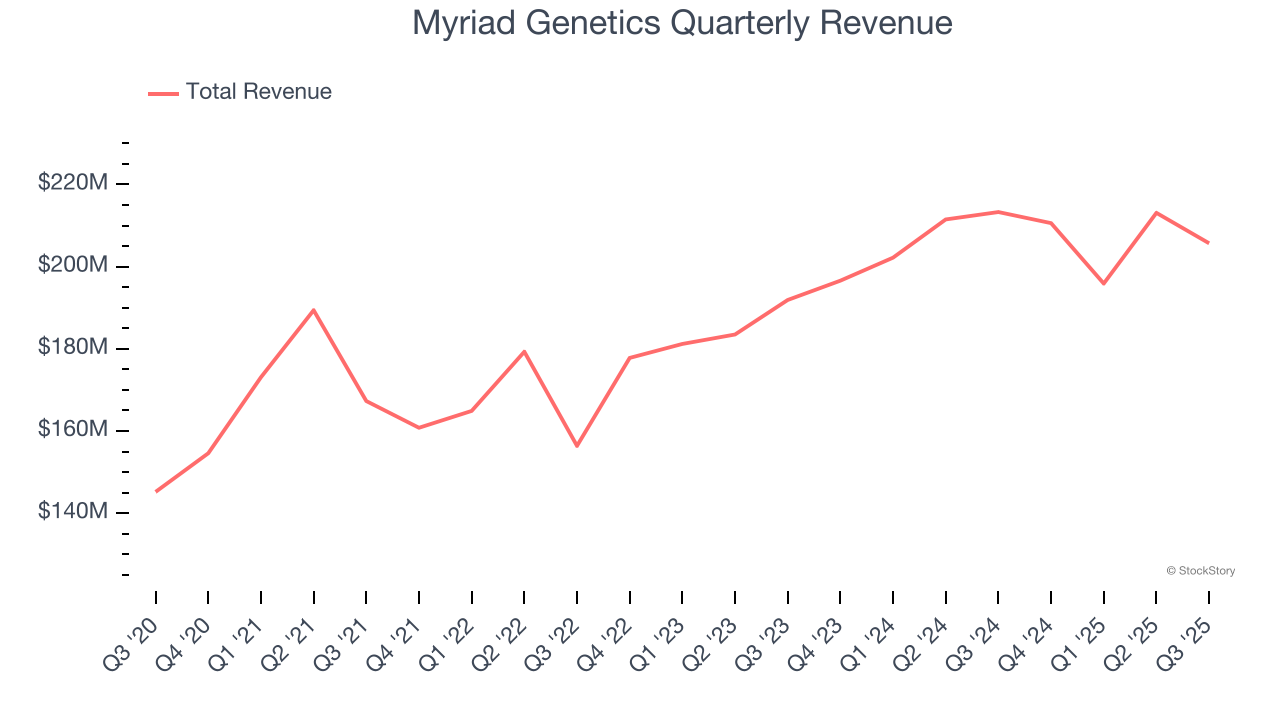
Genetic testing company Myriad Genetics (NASDAQ: MYGN) met Wall Streets revenue expectations in Q3 CY2025, but sales fell by 3.6% year on year to $205.7 million. The company’s outlook for the full year was close to analysts’ estimates with revenue guided to $823 million at the midpoint. Its non-GAAP loss of $0 per share was $0.01 above analysts’ consensus estimates.
Is now the time to buy Myriad Genetics? Find out by accessing our full research report, it’s free for active Edge members.
Myriad Genetics (MYGN) Q3 CY2025 Highlights:
- Revenue: $205.7 million vs analyst estimates of $204.8 million (3.6% year-on-year decline, in line)
- Adjusted EPS: $0 vs analyst estimates of -$0.01 ($0.01 beat)
- Adjusted EBITDA: $10.3 million vs analyst estimates of $5.57 million (5% margin, 84.8% beat)
- The company reconfirmed its revenue guidance for the full year of $823 million at the midpoint
- EBITDA guidance for the full year is $30 million at the midpoint, above analyst estimates of $27.52 million
- Operating Margin: -11.3%, down from -9.4% in the same quarter last year
- Free Cash Flow was $14.9 million, up from -$2.8 million in the same quarter last year
- Market Capitalization: $748.1 million
"I am pleased with our solid results for the quarter, including stable year-over-year revenue performance excluding previously noted headwinds, and 13% year-over-year volume growth for our MyRisk hereditary cancer test. Our disciplined execution also enabled our gross margin to be among the best in the industry and again yielded positive adjusted EBITDA,” said Sam Raha, President and CEO, of Myriad Genetics.
Company Overview
Founded in 1991 as one of the pioneers in translating genetic discoveries into clinical applications, Myriad Genetics (NASDAQ: MYGN) develops genetic tests that assess disease risk, guide treatment decisions, and provide insights across oncology, women's health, and mental health.
Revenue Growth
A company’s long-term sales performance is one signal of its overall quality. Any business can experience short-term success, but top-performing ones enjoy sustained growth for years. Over the last five years, Myriad Genetics grew its sales at a mediocre 6.7% compounded annual growth rate. This fell short of our benchmark for the healthcare sector and is a tough starting point for our analysis.
We at StockStory place the most emphasis on long-term growth, but within healthcare, a half-decade historical view may miss recent innovations or disruptive industry trends. Myriad Genetics’s annualized revenue growth of 6% over the last two years aligns with its five-year trend, suggesting its demand was consistently weak. 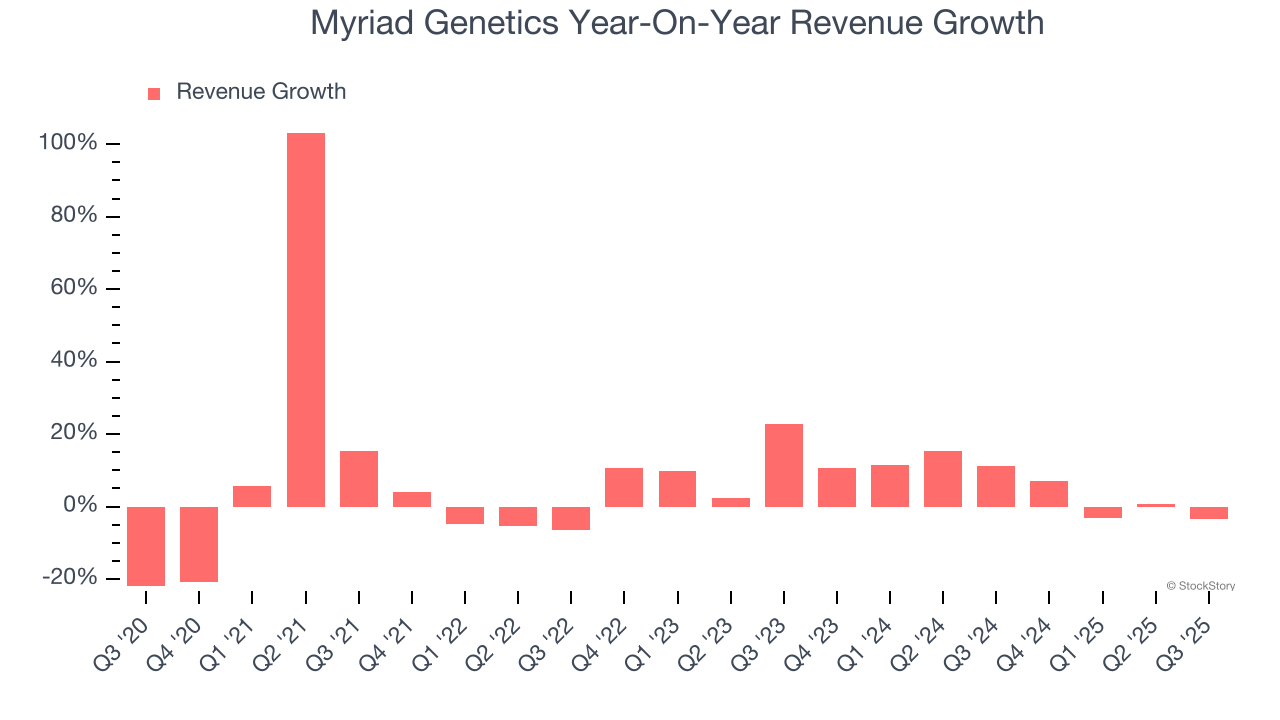
This quarter, Myriad Genetics reported a rather uninspiring 3.6% year-on-year revenue decline to $205.7 million of revenue, in line with Wall Street’s estimates.
Looking ahead, sell-side analysts expect revenue to grow 3.6% over the next 12 months, a slight deceleration versus the last two years. This projection doesn't excite us and suggests its products and services will face some demand challenges.
The 1999 book Gorilla Game predicted Microsoft and Apple would dominate tech before it happened. Its thesis? Identify the platform winners early. Today, enterprise software companies embedding generative AI are becoming the new gorillas. a profitable, fast-growing enterprise software stock that is already riding the automation wave and looking to catch the generative AI next.
Adjusted Operating Margin
Myriad Genetics was roughly breakeven when averaging the last five years of quarterly operating profits, lousy for a healthcare business.
On the plus side, Myriad Genetics’s adjusted operating margin rose by 1.9 percentage points over the last five years, as its sales growth gave it operating leverage. This performance was mostly driven by its recent improvements as the company’s margin has increased by 7.7 percentage points on a two-year basis.
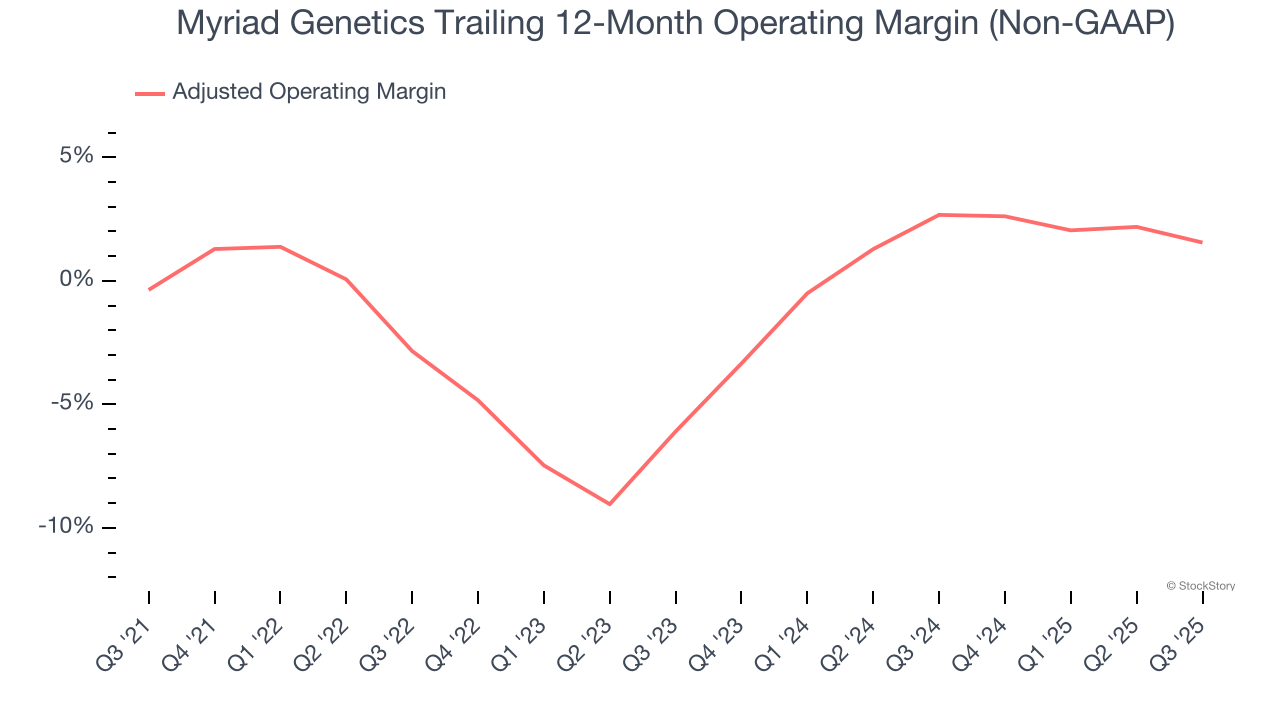
This quarter, Myriad Genetics generated an adjusted operating margin profit margin of 2%, down 2.5 percentage points year on year. This contraction shows it was less efficient because its expenses increased relative to its revenue.
Earnings Per Share
We track the long-term change in earnings per share (EPS) for the same reason as long-term revenue growth. Compared to revenue, however, EPS highlights whether a company’s growth is profitable.
Myriad Genetics’s full-year EPS flipped from negative to positive over the last five years. This is encouraging and shows it’s at a critical moment in its life.
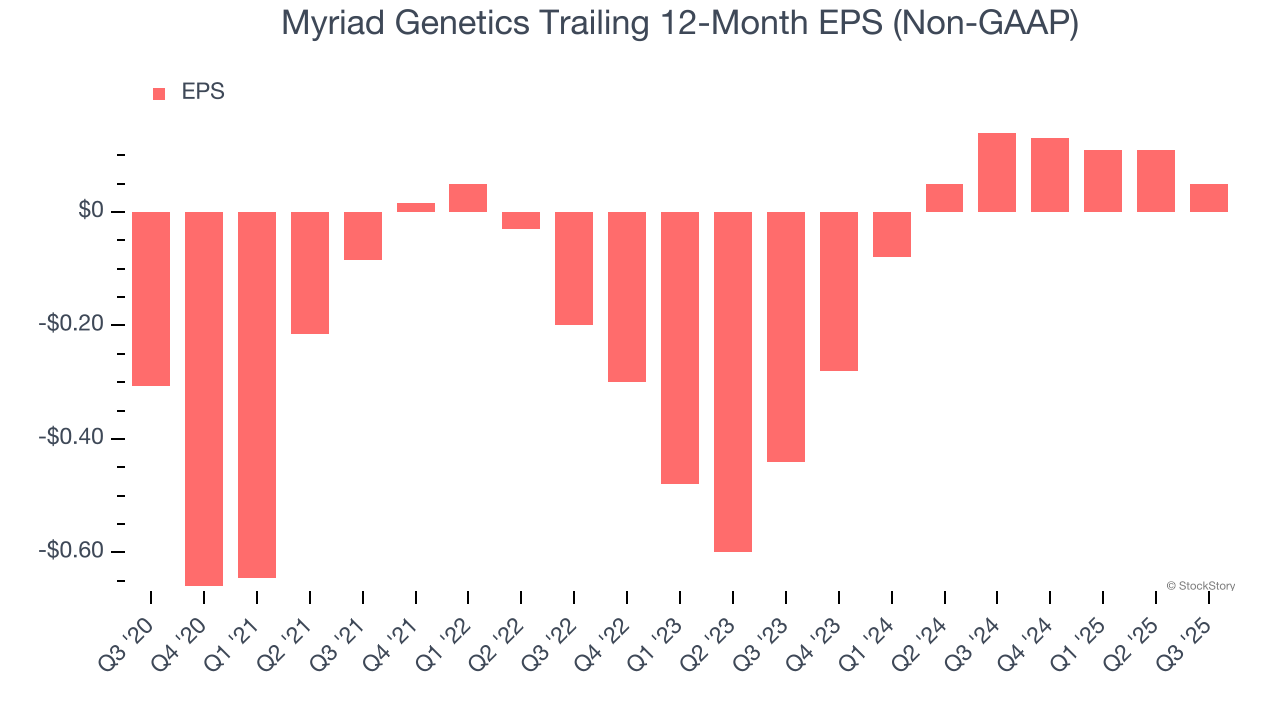
In Q3, Myriad Genetics reported adjusted EPS of $0, down from $0.06 in the same quarter last year. Despite falling year on year, this print easily cleared analysts’ estimates. Over the next 12 months, Wall Street expects Myriad Genetics’s full-year EPS of $0.05 to grow 34.2%.
Key Takeaways from Myriad Genetics’s Q3 Results
It was good to see Myriad Genetics beat analysts’ EPS expectations this quarter. We were also glad its full-year EBITDA guidance exceeded Wall Street’s estimates. On the other hand, its full-year EPS guidance missed. This seems to be weighing on shares, and the stock traded down 5.8% to $7.67 immediately after reporting.
Big picture, is Myriad Genetics a buy here and now? We think that the latest quarter is only one piece of the longer-term business quality puzzle. Quality, when combined with valuation, can help determine if the stock is a buy. We cover that in our actionable full research report which you can read here, it’s free for active Edge members.