Down 11% Last Week, Should You Buy the Robinhood (HOOD) Discount? Here’s What You Need to Know
Easily one of the strongest names in the market this year, Robinhood (HOOD) has delighted investors with its massive return of nearly 188% since the January opener. However, recent volatility — brought on by the fallout in artificial intelligence and the cryptocurrency sector — has raised questions about HOOD stock. In the trailing five sessions, the equity dipped 11%, while in the past month, it’s down roughly 16%.
Still, even with the severe pain, the case for optimism is evident. For one thing, cryptos have effectively opened Pandora’s box, demonstrating that decentralized assets can form and sustain their own viable economies. As such, an eventual recovery wouldn’t be unexpected. Second, Robinhood has become a cultural icon. Thanks to the COVID-19 crisis, it singlehandedly introduced millions to the investment ecosystem.
Of course, such statements represent known realities and don’t offer any insight as to whether or not you should consider buying HOOD stock at this juncture. Usually, the derivatives market provides some clues but for Robinhood, it’s extremely difficult to make sense of the noise.
On Friday, options flow — which focuses exclusively on big block transactions likely placed by institutional investors — showed net trade sentiment standing at about $2.08 million above parity. However, this figure was only modestly optimistic relative to gross bearish sentiment amounting to $7.703 million.
Plus, as a cumulative total, last week’s options flow amounted to $940,400. Considering the size and popularity of HOOD stock, the aforementioned figure really isn’t remarkable.
Nevertheless, what we do know about Robinhood is that its equity features a positive bias overall when considering HOOD’s price behaviors since its initial public offering. Given this tendency and combined with the stock’s behavioral topography, we can better understand the underlying risk-reward profile.
Using Empirical Data to Pinpoint a Strategy for HOOD Stock
Under the typical game plan, options traders will consult the implied volatility (IV) of the security that they’re targeting to get a better understanding of how the stock may respond to various outside pressures. However, this process is a bit deceptive as the IV is plugged into a non-bespoke or universal options pricing model known as Black-Scholes.
The problem here is that it’s erroneous to assume that every security has the same baseline characteristics, with the only difference being the magnitude of IV. In reality, we know that there are myriad pressure points that can disrupt the trajectory of the stock in question.
To execute genuine risk management, we need to understand where prices are likely to cluster given enough attempts. To do this, we can segment price action into multiple trials using a Kolmogorov-Markov framework with kernel density estimations (KM-KDE). Basically, the first half of this model governs the regime or behavioral state classification of the target security while the second half maps the stock’s forward distributional structure.
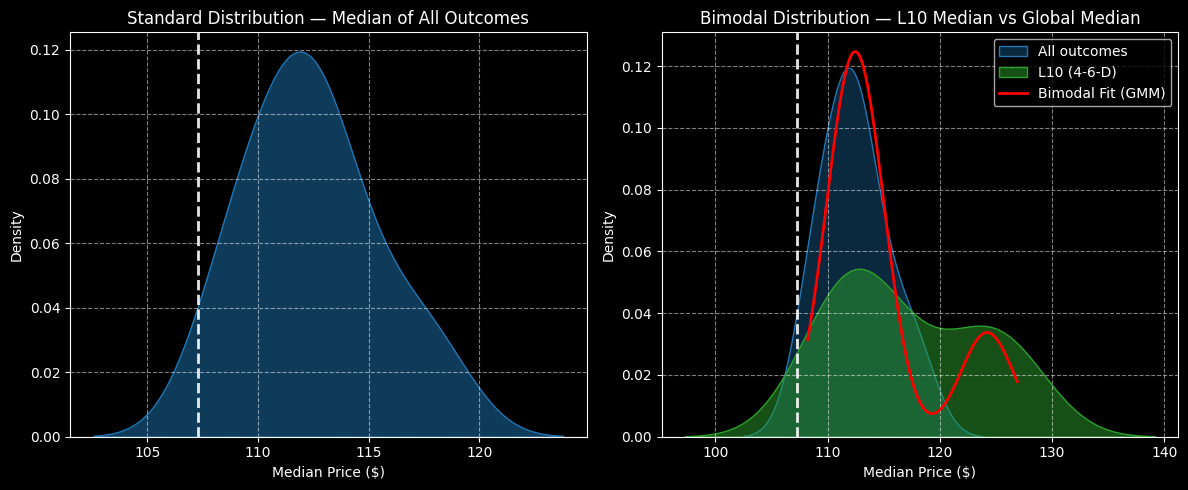
Using KM-KDE, the forward 10-week median returns of HOOD stock can be arranged as a distributional curve (as we’re measuring probability density as a function of price), with prices ranging between $102 and $124, assuming an anchor price of $107.30, Friday’s close. Further, price clustering would likely be predominant at $112, indicating an upward bias.
The above assessment aggregates all trials since Robinhood’s IPO. However, we’re interested in a specific signal, the 4-6-D; that is, in the past 10 weeks, HOOD stock printed four up weeks and six down weeks, with an overall downward slope.
Under this sequence, the forward 10-week returns would likely range between $95 and $139, with price clustering likely occurring at around $112.50. In fairness, there’s not much of a positive variance against the total aggregate. However, the reward tail jumps out much further than the risk tail, which is what makes HOOD stock intriguing.
Taking a Measured Bet
Given that we know prices will likely cluster between $112 and $113 under 4-6-D conditions, the most aggressive wager may be the 110/115 bull call spread expiring Jan. 16, 2026. This trade requires two simultaneous transactions: buy the $110 call and sell the $115 call, for a net debit paid of $230 (the most that can be lost).
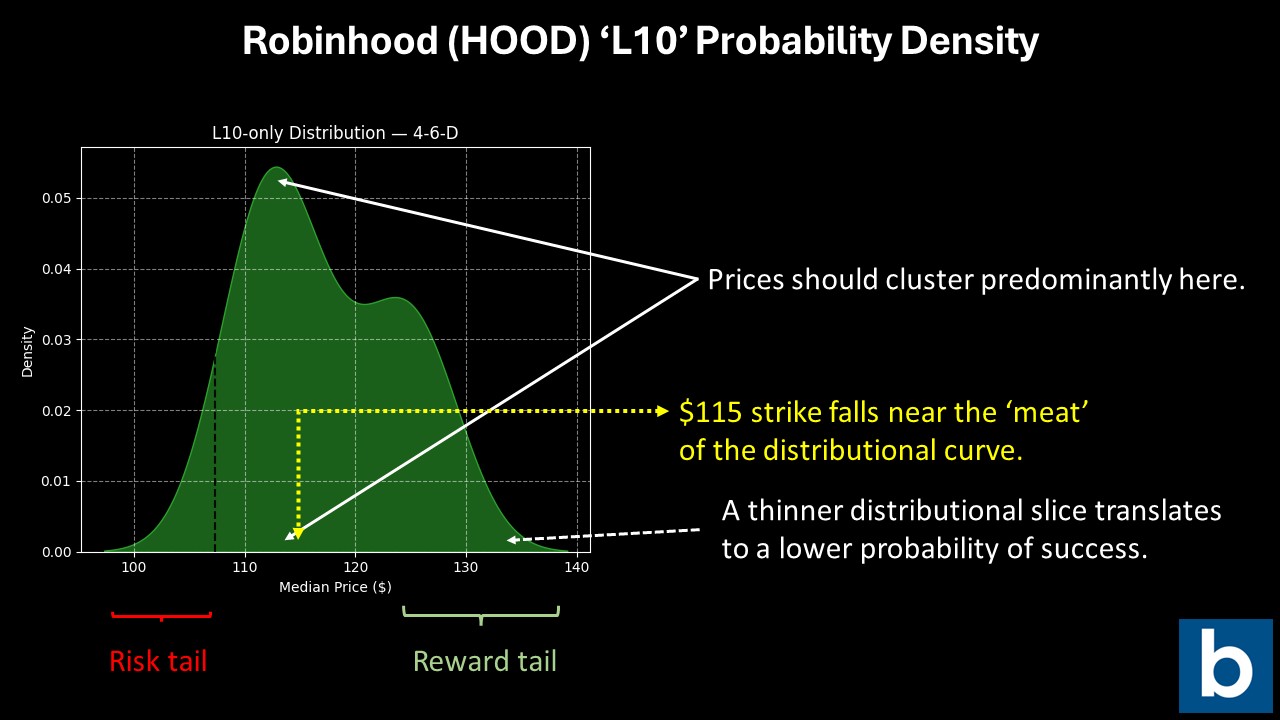
Should HOOD stock rise through the second-leg strike ($115) at expiration, the maximum profit would come out to $270, a payout of over 117%. Breakeven would be $112.30, which should be where the sweet spot is.
Using KM-KDE, we always have a rational basis for doing something. In this case, we’re considering a bull spread where the “trigger” strike is near the thickest part of the probability density curve. That just means that, based on past analogs, we have confidence that HOOD stock will land there at a greater rate than at any other price zone.
This is the kind of insight that Black-Scholes can’t teach you because of its one-size-fits-all approach. Instead, with KM-KDE, we let the empirical data of each security be our guide.
On the date of publication, Josh Enomoto did not have (either directly or indirectly) positions in any of the securities mentioned in this article. All information and data in this article is solely for informational purposes. For more information please view the Barchart Disclosure Policy here.
More news from Barchart
- Bridgewater Associates Is Giving Up on Lyft Stock. Should You?
- Warren Buffett Warns Not to Listen to Investing Gurus, ‘The Only Value of Stock Forecasters Is to Make Fortune Tellers Look Good’
- Should You Buy the New Elon Musk-Driven Hype in TSLA Stock or Stay Far Away?
- Bank of America Forecasts $40 EPS for Nvidia Stock in Just 5 Years. Should You Buy NVDA Here?
More News
View More


Recent Quotes
View More
Quotes delayed at least 20 minutes.
By accessing this page, you agree to the Privacy Policy and Terms Of Service.