Adobe Digital Price Index: Online Prices Fall 0.2% in September
- Online prices fell 0.2% on an annual basis in September, while rising 0.8% month-over-month
- Electronics and computer prices fell sharply, along with modest price decreases in toys and sporting goods
- Grocery prices hit another record high, while pet products and tools/home improvement prices remained elevated
Today, Adobe (Nasdaq:ADBE) announced the latest online inflation data from the Adobe Digital Price Index (DPI), powered by Adobe Analytics. In September 2022, online prices fell 0.2% year-over-year (YoY) while rising 0.8% month-over-month (MoM). In the month prior (Aug. 2022), online prices increased 0.4% YoY. In July 2022, e-commerce had entered deflation for the first time after 25 consecutive months of rising prices, dropping 1% YoY.
This press release features multimedia. View the full release here: https://www.businesswire.com/news/home/20221012005460/en/
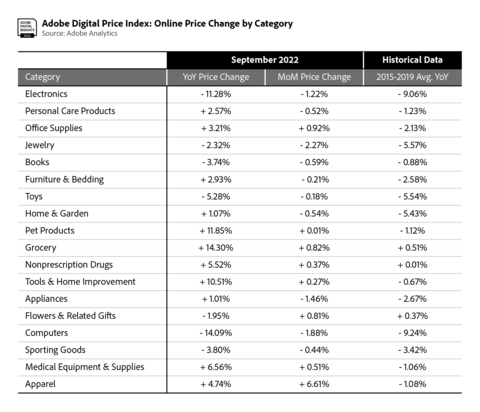
Price Table (Graphic: Business Wire)
Prices for electronics, the largest category in e-commerce with 18.6% share of spend in 2021, fell sharply and decreased 11.3% YoY (down 1.2% MoM). This is a greater YoY decrease than August (down 10% YoY) and July (down 9.3% YoY). Prices for computers also fell significantly and decreased 14.1% YoY (down 1.9% MoM), greater than the month prior when prices fell 12.6% YoY. The September price decreases for electronics and computers are both record lows in 2022.
Prices for food have remained high, with grocery prices rising 14.3% YoY (up 0.8% MoM), another record YoY high and the largest increase of any category. Prices for pet products also remain elevated, increasing 11.8% YoY (up 0.01% MoM). Other categories that saw prices jump in September include tools/home improvement (up 10.5% YoY, up 0.3% MoM) and apparel (up 4.7% YoY, up 6.6% MoM)—another major category in e-commerce, second only to electronics.
The DPI provides the most comprehensive view into how much consumers pay for goods online, as e-commerce expands to new categories and as brands focus on making the digital economy personal. Powered by Adobe Analytics, it analyzes one trillion visits to retail sites and over 100 million SKUs across 18 product categories: electronics, apparel, appliances, books, toys, computers, groceries, furniture/bedding, tools/home improvement, home/garden, pet products, jewelry, medical equipment/supplies, sporting goods, personal care products, flowers/related gifts, non-prescription drugs and office supplies.
In September, 11 of the 18 categories tracked by the DPI saw YoY price increases, with groceries rising the most. Price drops were observed in seven categories: electronics, jewelry, books, toys, flowers/related gifts, computers and sporting goods.
Eight of the 18 categories in the DPI saw price increases MoM. Price drops were observed across ten categories including electronics, personal care products, jewelry, books, furniture/bedding, toys, home/garden, appliances, computers and sporting goods.
Notable Categories in the Adobe Digital Price Index for September:
- Electronics: Prices were down 11.3% YoY (down 1.2% MoM), falling faster than pre-pandemic levels when electronic prices fell 9.1% YoY on average between 2015 and 2019. Prices have fallen consistently since Dec. 2021 (down 2.6% YoY) and accelerated in recent months (down 10% YoY in August, down 9.3% YoY in July).
- Computers: Prices were down 14.1% YoY (down 1.9% MoM), the biggest drop since the beginning of the COVID-19 pandemic in March 2020. Computer prices have fallen online for 21 consecutive months, and now outpace pre-pandemic levels when prices fell 9.2% on average between 2015 and 2019.
- Groceries: Prices continued to surge and rose 14.3% YoY (up 0.8% MoM), more than any other category. It is a new record on an annual basis, following a series of record highs: 14.1% YoY increase in August, 13.4% YoY increase in July, 12.4% YoY increase in June. Grocery prices have risen for 32 consecutive months, and it remains the only category to move in lockstep with the Consumer Price Index on a long-term basis.
- Pet Products: Prices were up 11.8% YoY (up 0.01% MoM), slightly below the record YoY high in the month prior (up 12.7% YoY in August). Online inflation for pet products has now been observed for 29 consecutive months, as pet ownership surged during the COVID-19 pandemic and demand for related goods remains high.
Methodology
The DPI is modeled after the Consumer Price Index (CPI), published by the U.S. Bureau of Labor Statistics and uses the Fisher Price Index to track online prices. The Fisher Price Index uses quantities of matched products purchased in the current period (month) and a previous period (previous month) to calculate the price changes by category. Adobe’s analysis is weighted by the real quantities of the products purchased in the two adjacent months.
Powered by Adobe Analytics, Adobe uses a combination of Adobe Sensei, Adobe’s AI and machine learning framework, and manual effort to segment the products into the categories defined by the CPI manual. The methodology was first developed alongside renowned economists Austan Goolsbee and Pete Klenow.
Adobe Analytics is part of Adobe Experience Cloud, which over 85% of the top 100 internet retailers in the U.S.* rely upon to deliver, measure and personalize shopping experiences online.
About Adobe
Adobe is changing the world through digital experiences. For more information, visit www.adobe.com.
*Per the Digital Commerce 360 Top 500 report (2021)
© 2022 Adobe. All rights reserved. Adobe and the Adobe logo are either registered trademarks or trademarks of Adobe in the United States and/or other countries. All other trademarks are the property of their respective owners.
View source version on businesswire.com: https://www.businesswire.com/news/home/20221012005460/en/
Contacts
Public relations contacts
Kevin Fu
Adobe
kfu@adobe.com
Bassil Elkadi
Adobe
belkadi@adobe.com
More News
View More


Recent Quotes
View MoreQuotes delayed at least 20 minutes.
By accessing this page, you agree to the Privacy Policy and Terms Of Service.