Adobe Digital Price Index: Online Inflation Continues to Slow in May at 2.0%
- Prices dropped 0.7% month-over-month; majority of product categories saw price decreases
- Consumers spent $78.8 billion online in May, over $1 billion more than the prior month
- Food costs remain high, with groceries overtaking apparel as top category for rising prices
Adobe (Nasdaq:ADBE) today announced the latest online inflation data from the Adobe Digital Price Index (DPI), powered by Adobe Analytics. In May 2022, online prices increased 2% year-over-year (YoY)—down from 2.9% YoY in April and the record 3.6% YoY increase in March—while decreasing 0.7% month-over-month (MoM). While this marks two full years of inflation online YoY, May is the second month where online price increases have slowed. The majority of categories tracked by the DPI (10 out of 18) saw MoM price decreases in May.
This press release features multimedia. View the full release here: https://www.businesswire.com/news/home/20220609005263/en/
(Graphic: Business Wire)
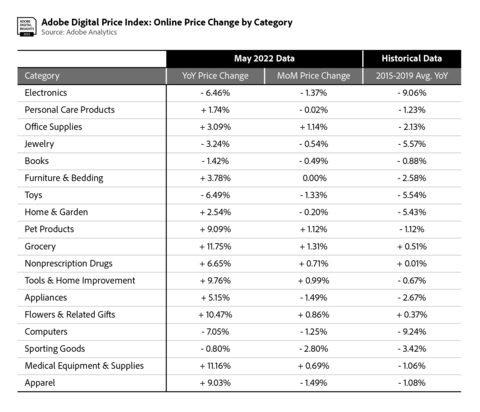
Prices for electronics and apparel, major categories that made up 33% of e-commerce spend in 2021, have continued to draw down. Electronics prices were down 6.5% YoY (down 1.4% MoM), a greater decrease than April (down 5.2% YoY), and a record YoY low for the category over the last 24 months. Prices for apparel increased 9% YoY (down 1.5% MoM), down from the 12.3% YoY increase in April. Toys are down 6.5% YoY (down 1.3% MoM), a record low for the category over the last 24 months. Prices have not eased for groceries, rising 11.7% YoY (up 1.3% MoM), a record YoY high for the category. This is the first month where prices for groceries have risen the most of any category, overtaking apparel.
In May, consumers spent $78.8 billion online, which represents 7.1% YoY growth. It is over $1 billion more than the month prior, when consumers spent $77.8 billion online (4.5% YoY growth), and below the $83.1 billion (7% YoY growth) that was spent in March. In 2022 so far, consumers have spent a total of $377.6 billion online, growing 8.9% YoY.
“Despite the modest increase in consumer spending online, an uncertain economic climate and rising costs in core areas like groceries are putting a hamper on overall demand,” said Patrick Brown, vice president of growth marketing and insights, Adobe. “Slower consumer spending on discretionary items has driven slower, single digit e-commerce growth since March, and this pullback mirrors the easing in online inflation.”
“E-commerce data has become an important input for measuring inflation as daily activities, including shopping, become more and more digital,” said economist Marshall Reinsdorf, former senior economist at International Monetary Fund. “In an uncertain economic environment, Adobe’s Digital Price Index is a timely indicator that often mirrors inflation movements happening offline while highlighting the tendency for inflation to be lower in the digital economy.”
The DPI provides the most comprehensive view into how much consumers pay for goods online, as e-commerce expands to new categories and as brands focus on making the digital economy personal. Powered by Adobe Analytics, it analyzes one trillion visits to retail sites and over 100 million SKUs across 18 product categories: electronics, apparel, appliances, books, toys, computers, groceries, furniture/bedding, tools/home improvement, home/garden, pet products, jewelry, medical equipment/supplies, sporting goods, personal care products, flowers/related gifts, non-prescription drug and office supplies.
In May, 12 of the 18 categories tracked by the DPI saw YoY price increases, with groceries rising the most. Price drops were observed in six categories: electronics, jewelry, books, toys, computers and sporting goods.
Eight of the 18 categories in the DPI saw price increases MoM. Price drops were observed across 10 categories including electronics, personal care products, jewelry, books, toys, home/garden, appliances, computers, sporting goods and apparel.
Notable categories in the Adobe Digital Price Index for May:
- Electronics: Prices were down 6.5% YoY (down 1.4% MoM). This is the largest YoY drop for the category since May 2020, when prices were down 6.8% YoY. As the biggest category in e-commerce by share of spend, price movements have an outsized impact on overall inflation online.
- Apparel: Prices were up 9% YoY (down 1.5% MoM). While the category has now seen 14 months of online inflation, reversing a predictable pattern of heavy discounting periods, there are continued signs that prices are beginning to ease; prices increased 12.3% YoY in April, 16.3% YoY in March and 16.7% YoY in February.
- Toys: Prices were down 6.5% YoY (down 1.3% MoM), the largest YoY drop for the category since December 2019 before the COVID-19 pandemic, when prices were down 10% YoY during the holiday shopping season. This is also the 14th consecutive month of deflation for the category as prices rose 0.2% YoY in March 2021.
- Groceries: Prices continued to surge and rose 11.7% YoY (up 1.3% MoM), setting another new record on an annual basis. This follows a 10.3% YoY increase in April, a 9% YoY increase in March and a 7.6% YoY increase in February—all record highs. This makes the first month where groceries have risen more than apparel, which had consistently been the top category for over a year. Groceries remains the only category to move in lockstep with the CPI on a long-term basis, with online prices rising now for 28 consecutive months.
Methodology
The DPI is modeled after the Consumer Price Index (CPI), published by the U.S. Bureau of Labor Statistics and uses the Fisher Price Index to track online prices. The Fisher Price Index uses quantities of matched products purchased in the current period (month) and a previous period (previous month) to calculate the price changes by category. Adobe’s analysis is weighted by the real quantities of the products purchased in the two adjacent months.
Powered by Adobe Analytics, Adobe uses a combination of Adobe Sensei, Adobe’s AI and machine learning framework, and manual effort to segment the products into the categories defined by the CPI manual. The methodology was first developed alongside renowned economists Austan Goolsbee and Pete Klenow.
About Adobe
Adobe is changing the world through digital experiences. For more information, visit www.adobe.com.
© 2022 Adobe. All rights reserved. Adobe and the Adobe logo are either registered trademarks or trademarks of Adobe in the United States and/or other countries. All other trademarks are the property of their respective owners.
View source version on businesswire.com: https://www.businesswire.com/news/home/20220609005263/en/
Contacts
Kevin Fu
Adobe
kfu@adobe.com
Bassil Elkadi
Adobe
belkadi@adobe.com
More News
View More


Recent Quotes
View MoreQuotes delayed at least 20 minutes.
By accessing this page, you agree to the Privacy Policy and Terms Of Service.