Square’s Fall Quarterly Restaurant Report: Full-Service Restaurants See Higher Wage Growth, Corresponding to Increased Inflation
New Square insights highlight trends in worker wages and tipping differences across states
Today, Square released the latest edition of its Quarterly Restaurant Report, which uses data across Square’s food and beverage sellers to examine dining trends, along with shifts in consumer spending and restaurant wages.
This press release features multimedia. View the full release here: https://www.businesswire.com/news/home/20241113623640/en/
Full-service restaurants have experienced higher inflation compared to quick-service restaurants (Graphic: Square)
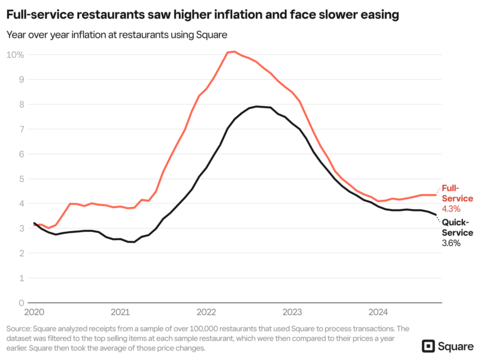
Full-service restaurants experience higher inflation
Following the COVID-19 pandemic, restaurants began to experience higher inflation caused by a number of factors like labor, supply chain issues, growing food prices, and increased operating costs. When comparing the price change for top selling items at restaurants, Square found that since February 2020, full-service restaurants have been hit harder with inflation compared to quick-service restaurants.
Inflation peaked for full-service restaurants in April 2022 at 10.1% compared to 7.2% for quick-service restaurants. Since then, inflation has cooled for both full-service and quick-service establishments, now at 4.3% and 3.6% respectively as of September 2024.
“Despite inflation easing, restaurants are continuing to face a number of challenges in their operations whether it’s fluctuating food prices, employee retention, or ballooning payroll costs. Many restaurants are grappling with how to balance these increased expenses while still offering affordability to customers. We’ve seen some restaurants lean on automation and other time-saving technology to keep margins under control,” said Ming-Tai Huh, Head of Food and Beverage at Square.
Wages grow faster among full-service restaurants workers
Increased labor costs have been a contributing factor to inflation in restaurants, with a larger part of a restaurant’s total revenue going towards payroll. This is especially true for full-service restaurants, where workers have seen faster wage growth compared to employees at quick-service restaurants. According to the Square Payroll Index, when tracking average hourly earnings (inclusive of base pay, tips, and overtime), wages for full-service workers have grown 73.9% compared to 60.2% for quick-service restaurants since 2017.
“The cost of labor is growing faster than revenues in some segments, compressing margins in an already tight sector. This trend will likely continue. Restaurants are hesitant to raise prices on consumers, but we remain in a pretty hot labor market so wage increases will have to come from somewhere if restaurants want to remain competitive,” said Ara Kharazian, Square Research Lead and principal developer of Square Payroll Index.
How much of a restaurant worker's income comes from tips?
In 2024, Square found the average restaurant worker earns nearly 23% of their income in tips versus 22% in 2023 (nationally). States where tips make up the highest percentage of overall wages are Wyoming (33%), South Dakota (31%), Alaska (31%), and Kansas (30%). Conversely, workers in Oklahoma, Mississippi, Arkansas, and Nebraska see tips make up the smallest percentage of their income compared to other states.
Nationally in 2024, Square observed the average tip on a restaurant transaction was 15.4% compared to 15.5% in 2023. The states with the highest average tip are Virginia (17.16%), Iowa (17%), and Delaware (16.77%), while California (14%), Hawaii (14.17%), and Connecticut (14.75%) have the lowest average tip, as of September 2024.
“Tips are a way for customers to reward our employees for their service, but our goal is to welcome anyone in so while tips are highly appreciated, it’s also understandable if tipping isn’t within someone’s budget,” said Jeff Litsey, owner of Calvin Fletcher’s Coffee Company in Indianapolis, IN. “Our employees are paid well above minimum wage to ensure they’re fairly compensated, with tipping being a smaller portion of their overall take home pay. Tipping is part of our business model. If tipping were to go away, we’d need to offset that proportion of staff’s wages with an increase to their base wage which would have ripple effects throughout our operations.”
Cafe culture differs across the world
Specialty coffee shops and independent cafes continue to be prominent hotspots within their communities, with same-store transactions at these establishments up 6% year over year as of Q3 2024. But across the world, when consumers visit coffee shops varies.
Square found that France and Spain have the highest share of coffee and bakery transactions later in the day, while early morning coffee visits are most prominent in the US and Australia. In the US, coffee shop traffic peaks at 9 am, while 11 am is the most popular time in Spain. France’s coffee culture shows consumers visit cafes consistently between 1 pm and 5 pm.
About Square
Square makes commerce and financial services easy and accessible with its integrated ecosystem of commerce solutions. Square offers purpose-built software to run complex restaurant, retail, and professional services operations, versatile e-commerce tools, embedded financial services and banking products, buy now, pay later functionality through Afterpay, staff management and payroll capabilities, and much more – all of which work together to save sellers time and effort. Millions of sellers across the globe trust Square to power their business and help them thrive in the economy. For more information, visit www.squareup.com.
View source version on businesswire.com: https://www.businesswire.com/news/home/20241113623640/en/
Contacts
More News
View More


Recent Quotes
View More
Quotes delayed at least 20 minutes.
By accessing this page, you agree to the Privacy Policy and Terms Of Service.