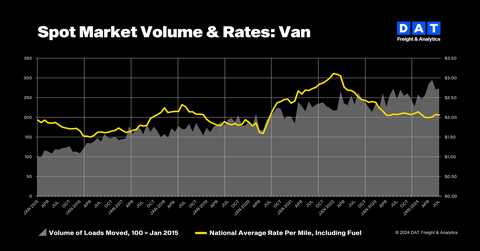
DAT: Truckload volumes rose in July as spot van rates hit parity year over year
Spot truckload freight volumes in July were stable for the second straight month and up more than 10% year over year, a signal that more than two years of deteriorating demand for truckload services may be nearing an end, said DAT Freight & Analytics, which operates the DAT One freight marketplace and DAT iQ data analytics service.
This press release features multimedia. View the full release here: https://www.businesswire.com/news/home/20240816883366/en/
Truckload volumes rose in July as spot van rates hit parity year over year (Graphic: DAT Freight & Analytics)
The DAT Truckload Volume Index (TVI), an indicator of loads moved during a given month, increased marginally for van and refrigerated (“reefer”) loads in July:
- Van TVI: 273, up 0.7% month over month
- Reefer TVI: 205, up 1.5%
- Flatbed TVI: 271, down 3.2%
The TVI was higher for all three equipment types compared to July 2023. The van TVI increased almost 10%, the reefer TVI was up 13%, and the flatbed TVI rose 4% year over year.
“Near-record container imports and weather-related supply chain disruptions helped drive loads to the spot market at a time when available capacity tightened,” said Ken Adamo, DAT Chief of Analytics. “The pricing environment for carriers showed signs of improvement. National average dry van and reefer spot linehaul rates in July were not year-over-year negative for the first time in 27 months.”
Spot rates held steady
National average spot truckload van and reefer rates held firm compared to June:
- Spot van: $2.06 per mile, down 1 cent
- Spot reefer: $2.45 a mile, unchanged
- Spot flatbed: $2.60 a mile, down 3 cents
Linehaul rates, which subtract an amount equal to an average fuel surcharge, were also flat. The average van linehaul rate was $1.63 a mile, down 1 cent compared to June and the same as in July 2023. The reefer rate fell 1 cent to $1.98, a penny higher year over year. The flatbed rate declined 5 cents to $1.97, which was 6 cents lower compared to July 2023. Monthly average flatbed rates have been within an 8-cent range since January.
National average rates for contracted freight were generally unmoved:
- Contract van rate: $2.43 per mile, down 1 cent
- Contract reefer rate: $2.81 a mile, unchanged
- Contract flatbed rate: $3.11 a mile, down 3 cents
Load-to-truck ratios declined
National average load-to-truck ratios declined for all three equipment types:
- Van ratio: 4.2, down from 4.7 in June, meaning there were 4.2 loads for every van truck on the DAT One marketplace.
- Reefer ratio: 6.5, down from 7.0
- Flatbed ratio: 11.9, down from 14.6
Ratios were higher compared to July 2023, when the average van ratio was 3.6, the reefer ratio was 5.4, and the flatbed ratio was 9.4. Load-to-truck ratios reflect truckload supply and demand on the DAT One marketplace and indicate the pricing environment for spot truckload freight.
About the DAT Truckload Volume Index
The DAT Truckload Volume Index reflects the change in the number of loads with a pickup date during that month. A baseline of 100 equals the number of loads moved in January 2015, as recorded in DAT RateView, a truckload pricing database and analysis tool with rates paid on an average of 3 million loads per month.
DAT benchmark spot rates are derived from invoice data for hauls of 250 miles or more with a pickup date during the month reported. Linehaul rates subtract an amount equal to an average fuel surcharge.
About DAT Freight & Analytics
DAT Freight & Analytics operates both the largest truckload freight marketplace and truckload freight data analytics service in North America. Shippers, transportation brokers, carriers, news organizations, and industry analysts rely on DAT for market trends and data insights based on more than 400 million annual freight matches, and a database of $150 billion in annual freight market transactions.
Founded in 1978, DAT is a business unit of Roper Technologies (Nasdaq: ROP), a constituent of the Nasdaq 100, S&P 500, and Fortune 1000. DAT is headquartered in Beaverton, Oregon.
View source version on businesswire.com: https://www.businesswire.com/news/home/20240816883366/en/
Contacts
DAT
Annabel Reeves
PR@dat.com / annabel.reeves@dat.com; 503-501-0143
More News
View More


Recent Quotes
View More
Quotes delayed at least 20 minutes.
By accessing this page, you agree to the Privacy Policy and Terms Of Service.