Using MarketBeat Market Data Tools To Find Strong Stocks in a Bear Market
 A bear market occurs when the underlying stock or index falls at least 20% from its highs for more than 60-days. The risk-on buy-the-dip strategy reverses into a risk-off and sell-the-rip stance. Bear markets go through periods of panic that is often described as throwing out the baby with the bathwater. In these situations, it’s tough to find long-side winner, as its more a matter of finding stocks that take the least damage on the way down. This relative strength often enables the “buy fading” stock to recover faster on the way back up.
 The key to finding these stocks is utilizing tools to help screen for candidates automatically and then apply filtering and analysis to arrive at a handful of potential winners. This gets significantly tougher in a bear market. MarketBeat has a number of free and paid tools to help investors select potential stocks for their portfolio or speculation. The MarketBeat Stock Market Data Tools provides a number of pre-filtered candidates for users to peruse. Here are some useful free tools to use for finding relative strength stocks that can snap back quicker in a rising market. It’s crucial to consider these tools to find candidates, not to dive right into the stocks without doing proper research, and fundamental and technical analysis to assess opportunistic pullback levels for exposure.
52-Week Highs
This is a list of stocks that are making new 52 week highs in the bear market. Stocks on this list naturally have relative strength as they are fading the selling in the market. Just like trying to sink a tennis ball in the bathtub, the ball remains buoyant when you push it down and bounces back harder when you let go. It is important to avoid the temptation of chasing these stocks, especially if they are cheap meme stocks having a short squeeze or extraordinary volume spikes. These stocks very likely create a trail of bagholders when the smoke clears, and volume falls back to normal. Avoid stocks that trade at over 20X average volume rising high double and even triple digits.
This is why it’s important to perform the underlying research into the operations to make sure it’s not just a pump and dump stock. It’s also worth avoiding holding companies, buyouts, shells, SPACs, and any stocks that don’t have actual business operations. Make sure you understand the reasons why the stock is going against the grain and showing relative strength. Users can adjust the filters as well including Sector and Market Cap. MarketRank, Media Sentiment and Analyst Consensus are available for paid subscribers. For example, Safety Insurance Group (NASDAQ: SAFT) stock hit new 52-week highs trading only at 14.6X earnings with a 3.62% dividend yield. The 52-week range have been relatively stable between $74.95 to $99.75, which offsets the rather light volume under 100,000 shares per day.
Apply Technical Analysis to Find Opportunistic Pullback Levels
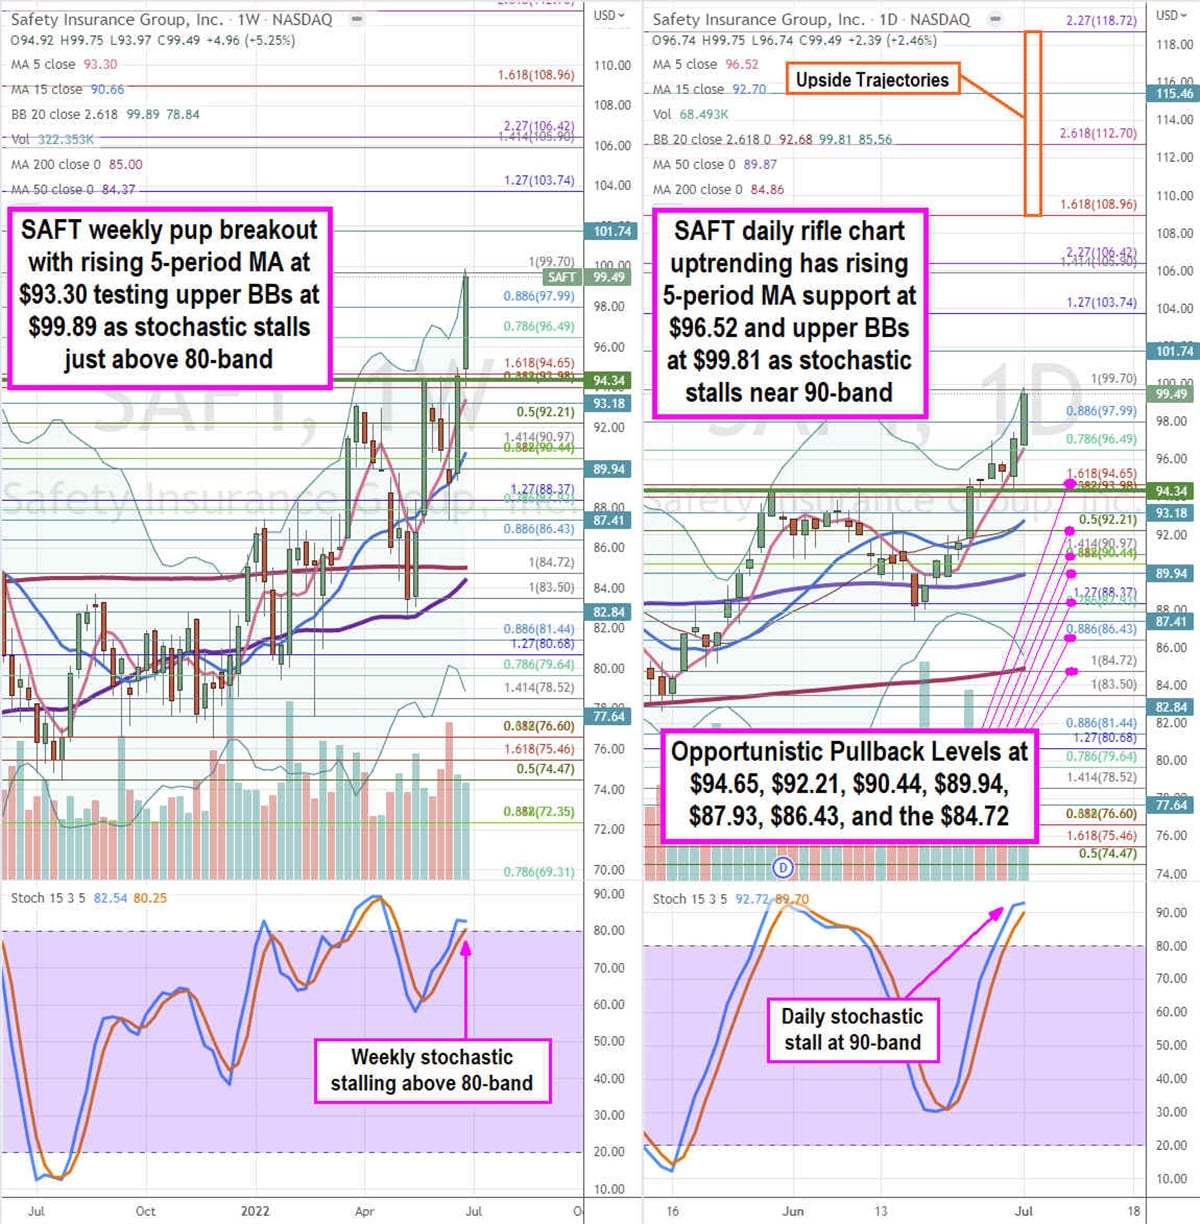
Using the rifle charts on the weekly and daily time frames provides a precision view of the landscape for SAFT stock. The weekly rifle chart bottomed near the $74.47 Fibonacci (fib) level before staging a rally to new 52-week highs at $99.75. The weekly rifle chart uptrend has a rising 5-period moving average (MA) support at $93.30 with a rising 15-period MA at $90.66. The weekly upper Bollinger Bands (BBs) are expanding at $99.89. The weekly 200-period MA support sits at $85.00 and 50-period MA sit at $84.37. The weekly lower BBs sit at $78.84. The weekly market structure low (MSL) buy triggered on the $94.34 breakout. The daily rifle chart breakout has a rising 5-period MA at $96.52 and upper BBs at $99.81 followed by the 15-period MA at $92.70. The daily 50-period MA sits at $89.87. The daily 200-period MA support sits near the $84.72 fib below the $85.56 lower BBs. Prudent investors can watch for opportunistic pullback levels at the $94.65 fib, $92.21 fib, $90.44 fib, $89.94, $87.93 fib, $86.43 fib, and the $84.72 fib level. Upside trajectories range from the $108.96 to the $118.72 fib level.
Finding Lagging Peer Candidates
Instead of chasing stocks at 52-week highs, it’s also a good idea to look for peers or competitors that are lagging. It’s important to know whether it’s a company-specific reason or a group systemic reason for the relative strength. If it’s the latter, then it’s worth searching for potential lagging competitors. These can be found by clicking the Competitors tab on the Stock Forecast, Price & News Page.
Negative Beta Stocks
Beta is the ratio that a stock moves relative to the benchmark S&P 500 index. A one-to-one mover would give a beta of 1. A stock that moves twice as much as the index would get a beta of 2. Higher beta stocks are more volatile as they tend to overshoot the moves both ways. On the flipside, a negative beta would be the inverse movement of the S&P 500. Therefore a -1 beta would mean the underlying stocks falls when the index rises and rises when the index falls on a 1 for 1 basis. Keep in mind, this is theoretical, and data-driven. Having a list of negative beta stocks can help potentially hedge your portfolio against deep market sell-off. These are more of a defensive trade. However, there can be a lot of candidates to sift through.
More News
View More


Recent Quotes
View More
Quotes delayed at least 20 minutes.
By accessing this page, you agree to the Privacy Policy and Terms Of Service.