Is Fifth Third Bancorp a Stalwart Among Regional Banks?

The Silicon Valley Bank disaster has spread contagion fears throughout the regional banking industry. Regional bank Fifth Third Bancorp (NASDAQ: FITB) stock has been pummeled with the rest of the regional banks. Shares are trading down (23.5%) for 2023. The banks are facing a “throw the baby out with the bath water” panic situation that’s seeing continued waves of selling in bank stocks. Fifth Third may be in a better position than others.
Fifth Third Bank was formed from the merger between Fifth National Bank and Third National Bank in 1908. The bank has over $200 billion in assets serving the U.S.'s Midwest and Southeast regions. Its portfolio concentrates mostly on commercial and industrial (C&I), residential real estate, and auto loans.
Fifth Third Bank Liquidity
From its Q4 2022 earnings report, Fifth Third's allowance for credit losses (ACL) was 1.98% of its portfolio of loans and leases. It had $5.2 billion in Holding Company cash which it states is sufficient to meet all fixed obligations during a "stressed environment" for 24 months. A reassuring metric was its loan-to-core deposit ratio (LDR) of 76%, with over $102 billion in available liquidity sources. The bank expects full-year 2023 revenues to grow 9% to 10% to $9.25 billion to $9.44 billion versus $9.36 billion consensus analyst estimates. It expects net interest income to rise 13% to 14% YoY.
Fifth Third Bancorp released a statement in the wake of the Silicon Valley Bank collapse, "Fifth Third has none of the issues that are impacting some of the technology-focused banks. We are in a position of strength, with a strong balance sheet - capital, liquidity, securities positioning, and granular & stable deposits which have continued to grow."
How Did the Liquidity Crisis Unfold?
The Silicon Valley Bank and Signature Bank failures revolve around their billions in underwater treasuries that dropped as interest rates rose. The bank was bleeding as the inverse yield curve turned its loans red, with interest rates spiking nearly 4.5% in a year. Rather than take the losses, they tried to hold to maturity (HTM) to recoup the paper losses, but massive bank runs forced them to liquidate, taking the losses as counterparties turned away on new funding. This resulted in the most significant banking collapse since the financial meltdown of 2008. Naturally, this brought about contagion fears with other regional banks that didn't have to adhere to Dodd-Frank.
The Fed Provides a Mini TARP Program
The U.S. Federal Reserve stepped in, announcing plans to provide liquidity under a Bank Term Funding program for depositors to recoup their monies beyond the $250,000 FDIC insurance limit. At first, they had no plans to save the banks or shareholders. But contagion fears and systemic risk caused them to initiate a mini-TARP program that will enable banks to trade in their underwater treasuries at the maturity value, which lets them off the hook since the Fed is in a better position to hold them to maturity. The assets are what separates 2023 from 2008. In 2008, the big banks held a ton of MBS and CDOs linked to underwater prime mortgages.
NINJA Kills
These interest-only NINJA (No Income, No Job, No Assets) loans were like the lower blocks in a game of Jenga as 30X overleveraged investment banks imploded overnight as CDO values evaporated and contagion spread into a full-blown systemic credit crisis. The U.S. Fed stepped in with its trouble asset relief program (TARP) and quantitative easing. It essentially printed money to provide liquidity by buying the "troubled assets" from the banks. Unlike in 2008, the Fed would buy back its treasuries, taking no losses if held to maturity. Problem solved. Well, not really.
Big Banks to the Rescue?
A consortium of banks came to the rescue of First Republic Bancorp (NYSE: FRC), vowing to make $5 billion deposits led by JPMorgan Chase & Co. (NYSE: JPM), Citigroup Inc. (NYSE: C), and Bank of America (NYSE: BAC) to provide liquidity. The Swiss National Bank extended a credit line of $30 billion to Credit Suisse AG (NYSE: CS) to mitigate European bank contagion fears. In the short term, it's all about sentiment. Even with reassurances from the banks and the Fed, weakening sentiment can cripple stock prices even if unfounded. However, Fifth Third Bancorp is in a better liquidity position than technology and venture capital-based banks.
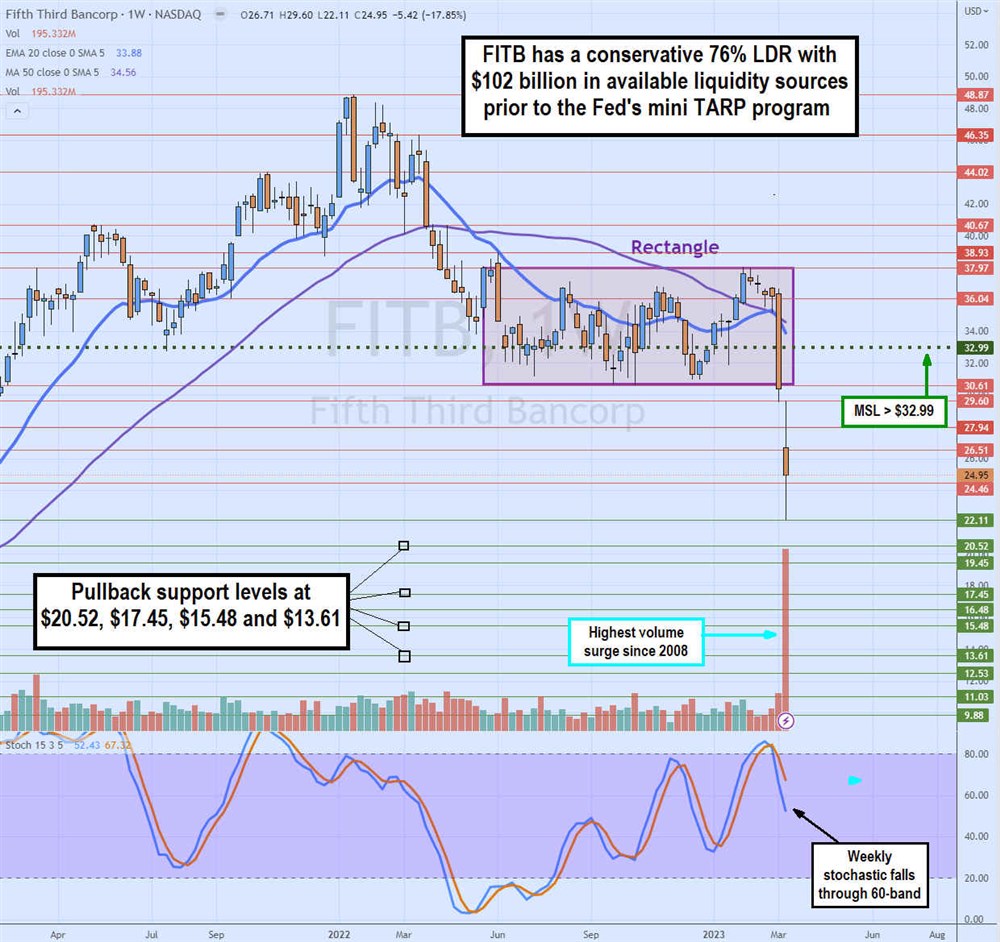
Weekly Rectangle Breakdown
The bank stocks are currently in a "throw the baby out with the bath water" panic. This can result in extensive volatility, so planning ahead of any trades is crucial. The weekly candlestick chart shows the recent collapse through the nearly year-long weekly rectangle range, which started in May 2022. The upper rectangle trendline resistance is $37.97. The lower rectangle support was at $30.61. However, that lower rectangle support was broken severely by the regional bank sell-off, which caused shares to crumble through the weekly market structure low (MSL) trigger at $32.99 to fall to a near-term low of $22.11. The weekly stochastic has fallen through the 60-band oscillating down. Pullback support levels are at $20.52, $17.45, $15.48, and $13.61. It's worth noting that the weekly volume bar has yet to see this high since the 2008 financial meltdown.
More News
View More


Recent Quotes
View More
Quotes delayed at least 20 minutes.
By accessing this page, you agree to the Privacy Policy and Terms Of Service.