Want Diversified Upside in Biotechnology? Check out LABU

Watch the Direxion Daily S&P 500 Biotech Bull 3X Shares (NYSEARCA: LABU) if you want a speculative play in the biotechnology industry with amplified volatility. This ETF attempts to mimic 3X the one-day performance of the SPDR S&P 500 Biotech ETF (NYSE: XBI). Remember the keyword "attempts." On any trading day, the LABU attempts to move 3X the S&P Biotechnology Select Industry Index.
Since you can't buy an index, an ETF that moves with the index is the next best thing. In this case, the XBI ETF fits the bill. Looking at the performance tracking, the XRT fell 2.21%, while LABU fell 6.46% on March 17, 2023. There will be fractions of a difference in the percentages that may rack up over time. That's why LABU is designed for short-term trading, not long-term holding.
About LABU
This 3X ETF has an inception date of March 28, 2015. Rafferty Asset Management actively manages it. Direxion states that LABU shouldn't be expected to match the benchmark returns on a cumulative return basis for periods beyond a single day. Triple-leveraged ETFs undergo daily rebalancing and are best suited for short-term trading, either as a directional play or a hedge.
LABU has excellent liquidity, trading over 40 million shares daily. It has an expense ratio of 1.01%. It has an inverse version called Direxion Daily S&P Biotech Bear 3X Shares (NYSEARCA: LABD), which mimics 3X the inverse performance of the XBI. If you want to avoid getting hit with the compounding effect with a longer-term focus, consider the non-leveraged XBI ETF.
State of the Biotech Industry
Biotechnology is a high-risk industry. Biotech companies are often in the early stages of drug discovery and development. This requires much capital and heavy reliance on clinical trial results and the U.S. Federal Drug Administration (FDA) approvals. Since so many need to generate revenues, they are often valued based on their potential pipeline and earnings. They are also acquisition and partnership targets by more prominent pharmaceutical companies that can provide the distribution capacity if a drug gets FDA approval.
These drive the upside with biotech stocks. The downside is the very real likelihood of not receiving its intended clinical trial results or FDA approval after spending millions of dollars with little to no revenues to show for it. Keep in mind that the stats are lined up against biotech companies as only 9% of drugs make it to an FDA approval at an average total cost of $1.5 billion over a decade.
However, the upside can be tremendous for companies that get FDA approval. Taking a look at the XBI, it peaked at $174.79 in February 2021 and has fallen over (50%) to $76.50. It's trading down (17%) versus LABU, down (68%) in one-year performance.
Top Holdings
LABU is diversified through 187 holdings, with the most significant being Madrigal Pharmaceuticals Inc. (NASDAQ: MDGL), representing 3.67%, followed by Arrowhead Pharmaceuticals Inc. (NASDAQ: ARWR) with 1.29% and Cytokinetics Inc. (NASDAQ: CYTK) at $1.23%. This is designed so that a single company will only impact the fund a little in cases of implosion or explosion.
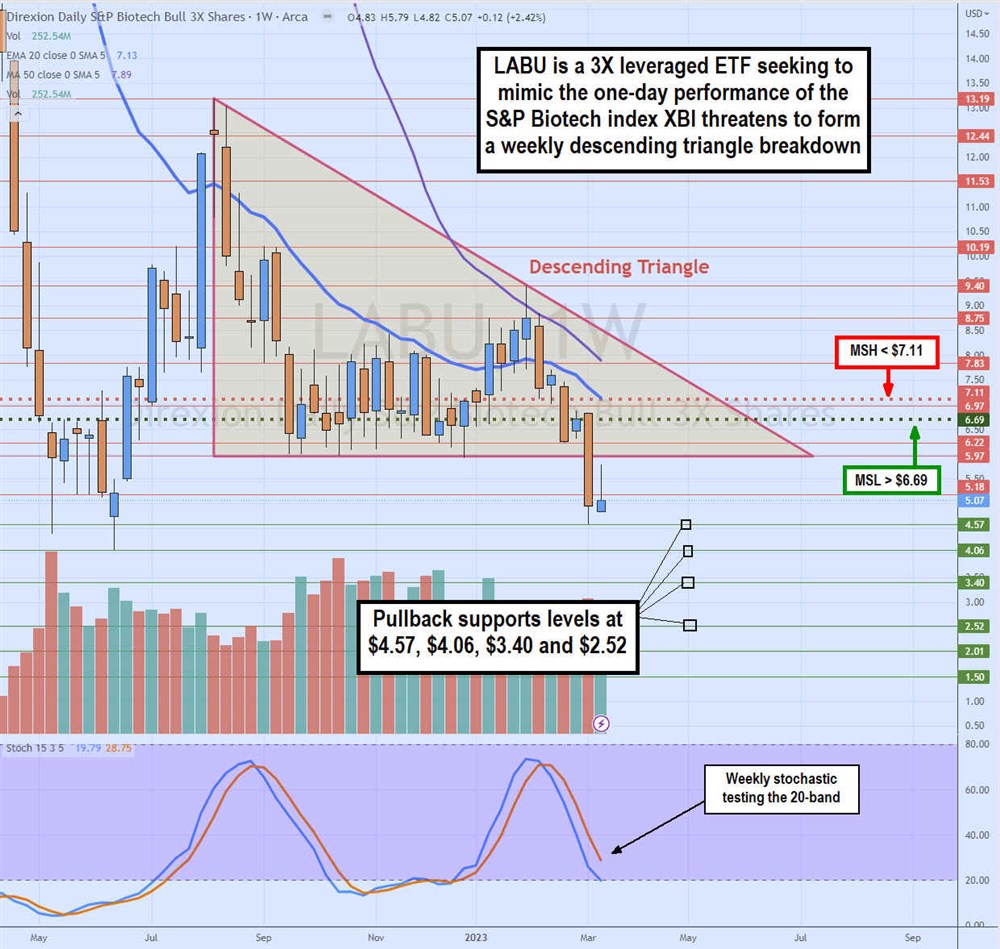
Weekly Descending Triangle Breakdown
The weekly candlestick chart on LABU illustrates the weekly descending triangle comprised of a flat bottom trendline and a falling trendline representing lower highs. The triangle started forming after shares peaked at $13.19 in August 2022. LABU sold off to $5.92 before triggering the weekly market structure low (MSL) breakout through $6.59.
Shares climbed up to $9.40 in January 2023 before falling back down on the weekly market structure high (MSL) sell trigger under $7.11. The weekly 20-period exponential moving average (EMA) falls at $7.13, followed by the weekly 50-period MA at $7.89. LABU fell to the $5.97 flat lower trendline but collapsed through March 2023 as shares reached a new swing low of $4.57. Pullback support levels are at $4.57, $4.06, $3.40, and $2.52.
More News
View More


Recent Quotes
View More
Quotes delayed at least 20 minutes.
By accessing this page, you agree to the Privacy Policy and Terms Of Service.