US Foods is Managing Inflation Deceleration the Right Way
 In all industries, some companies are a cut above the rest. They are just better managed. Inflation has been on a wild ride hitting a high of 9.1% in June 2022 and falling to 4.8% by June 2023. The acceleration of inflation was a boon for food distributors driving margin expansion. However, the deceleration of inflation has become an affliction as margin compression emerged just as fast.
In the food distribution business, a handful of companies distribute food to thousands of businesses, restaurants, hotels, schools, grocery stores and retail outlets. The contrast between the best and not-so-best-managed food distributors is like night and day.
Outperforming Competition
Organic foods and grocery products distributor United Natural Foods (NASDAQ: UNFI) exemplifies how margin deflation can cripple profits. US Foods Holdings Inc. (NASDAQ: USFD) exemplifies how exceptional management manages it correctly. This is evidenced by the contrasting US Food's year-to-date (YTD) performance of up 29.1% versus United Natural's 46.13% drop YTD.
The company also competes with food service distributors Sysco Inc. (NYSE: SYY) and Performance Food Group Co. (NYSE: PFGC). US Food may boast stronger margins than competitors due to its overwhelming mix of independent restaurants, which bodes for higher margins than supplying well-known branded and chain restaurants.
Pre-Pandemic to Post-Pandemic Journey
US Foods made an untimely $970 million acquisition of Smart Foodservice Warehouse in Q1 2020 as the pandemic started as shares collapsed from $43.10 to a low of $8.32. It saw its Q2 2020 sales collapse by 30%, but shares managed to bounce with the rest of the market.
The post-pandemic period saw aggressive inflation climbing as demand outstripped rattled supply chains. Like other food distributors, US Foods saw its margins and profits expand taking sales up to $34.1 billion in 2022 with operating earnings growing to $594 million.
The Haves and the Have Nots of Adjusted EPS
Adjusted earnings surged to $2.14 per share, up 38%. Management guided the 2023 adjusted EPS to be around $2.45 to $2.65. This is where competitors like United Natural also upped their 2023 forecasts, only to miss by a mile and walk down estimates in back-to-back quarters.
United Naturals saw its adjusted EPS slashed in half in 2023. US Foods has maintained and continued to grow its adjusted EPS. US Foods saw a 39.8% rise in adjusted EBITDA to $337 million in its Q1 2023.
Sidestepping Inflation Deceleration
On May 11, 2023, US Foods released its fiscal first-quarter 2023 results for March 2023. The Company reported a profit of 50 cents per share, beating consensus analyst estimates of 42 cents by 8 cents. Revenues rose 9.5% year-over-year (YoY) to $8.54 billion, beating consensus analyst estimates for $8.49 billion.
Total case volume rose 5.7%, and independent restaurant case volume rose 8.1%. Gross profit was 16.7%, and adjusted gross profit was $1.4 billion, up 14%. Net come was $75 million, up $91 million from the year-ago period, which adjusted EBITDA rose 39.8% to $337%. Adjusted EBITDA margin was 3.9%, up 80 basis points.
US Foods CEO Dave Flitman commented, “We grew total case volume by nearly 6% and independent restaurant case volume by 8% while improving our cost structure and profitability. For the quarter, we grew Adjusted EBITDA by 40% and expanded Adjusted EBITDA margin by 80 basis points.” The upbeat
In-Line Guidance
US Foods guided full-year fiscal 2023 EPS of $2.45 to $2.65 versus $2.56 consensus analyst estimates. US Foods' pre-pandemic 2020 guidance was around $2.70 per share. The company expects adjusted EBITDA of $1.45 billion to $1.51 billion.
Analyst Upgrade and Acquisition
Morgan Stanley upgraded shares of US Foods to Overweight from Equal-Weight and lifted its price target to $54, up from $36 per share. On May 19, 2023, US Foods announced the acquisition of Renzi Foodservice to expand its footprint into central upstate New York.
Renzi generates $180 million in annual revenues servicing over 2,300 customers in the restaurant, education, healthcare and grocery business. The deal is expected to close in Q3 2023.
US Foods analyst ratings and price targets are at MarketBeat.
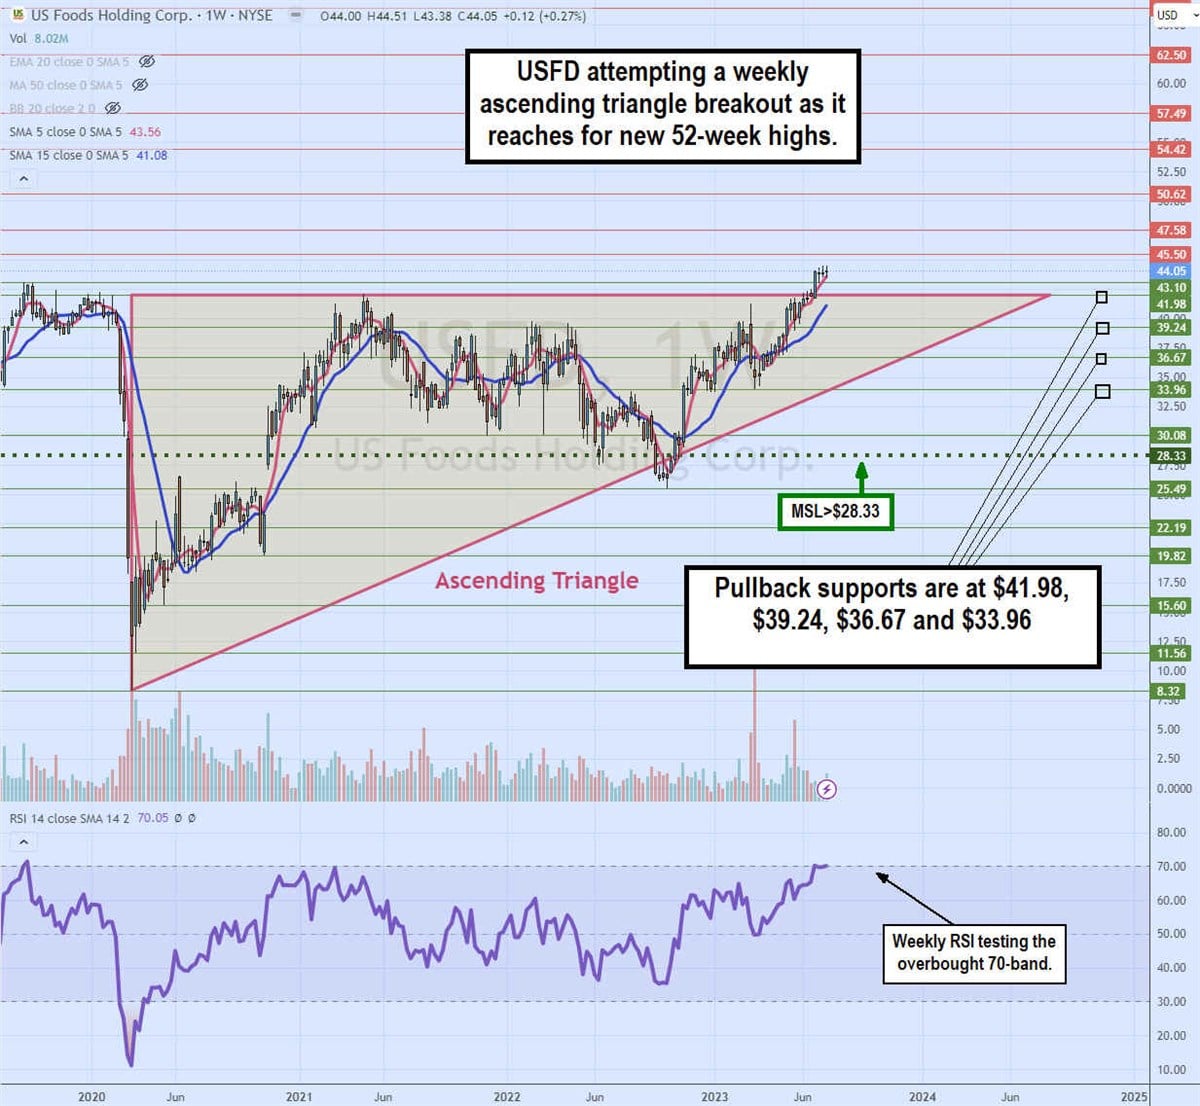
Weekly Ascending Triangle Breakout
The weekly candlestick chart on USFD illustrates an ascending triangle breakout attempt. The ascending triangle commenced in January 2020 as shares peaked at the $41.98 peak and proceeded to collapse on the advent of the pandemic.
Shares fell to a low of $8.32 by March 2020. The weekly relative strength index (RSI) fell to the extremely oversold 10-band before springing back up. Shares rallied back to the $41.98 peak by April 2021 but continued to reject. Pullbacks were shallow as the deepest pullback fell to $25.49 in October 2022, triggering a market structure low (MSL) breakout through the $28.33 trigger that continued to grind higher until the flat-top trendline was broken at the end of June 2023.
The weekly RSI has been slowly rising to test the overbought 70-band as shares reached new 52-week highs. Pullback support levels are $41.98, $39.24, $36.67 and $33.96.
More News
View More


Recent Quotes
View More
Quotes delayed at least 20 minutes.
By accessing this page, you agree to the Privacy Policy and Terms Of Service.