2 Stocks that Doubled Earnings Estimates and Sold Off

With the second-quarter 2023 earnings season underway, many earnings reaction trends are taking place. Companies that beat earnings estimates and raise guidance usually see their stocks gap and go higher. Companies that miss estimates and low guidance tend to gap down and dump lower.
Stocks may also gap on worse-than-expected earnings due to an exceptional result on a certain financial metric and vice versa. However, strange occurrences exist where companies crush their earnings estimates and still gap down on the results. Some reverse reactions to earnings results can be attributed to "sell the news" or "already priced in" factors.
Here are two companies that doubled earnings estimates and still gapped or sold off lower anyway. These could be potential value plays for investors seeking exposure to stocks with strong fundamentals at a discount.
Cheniere Energy Inc. (NYSEAMERICAN: LNG)
Cheniere is one of those companies with a stock symbol representing its business line, like C3.ai Inc. (NYSE: AI) for artificial intelligence and Samsara Inc. (NYSE: IOT) for internet-of-things. Cheniere is a major player in the energy sector's liquified natural gas (LNG) segment. LNG is natural gas cooled into a cryogenic liquid state at -260 degrees Fahrenheit or -160 degrees Celsius.
Its volume is also 1/600th of its original form when it's liquified. It's not flammable.
This enables the natural gas to be shipped safely and in volume aboard LNG vessels. LNG is used for various functions like power and heat generation, fuel and chemical production. LNG burns cleaner than fossil fuel producing less pollutants and greenhouse gases. The LNG mark was 380 million tonnes in 2021 and is expected to grow to 500 million tonnes of production in 2030.
Blowout EPS But Weak Revenues
Cheniere Energy is a leader in LNG. It procures, liquifies, produces and ships LNG around the world. Its customers range from industrial facilities to regasification plants where the LNG is transformed back into natural gas for usage. The company reported blowout earnings-per-share (EPS) of $5.61 versus $2.81 consensus analyst estimates, a whopping $2.80 beat.
However, revenues fell 48.8% YoY to $4.1 billion, missing estimates of $4.25 billion. LNG shares trade at 10.86X forward earnings and pays a 0.93% annual dividend rate.
Cheniere Energy analyst ratings and price targets are at MarketBeat.
Daily Cup and Handle Breakout
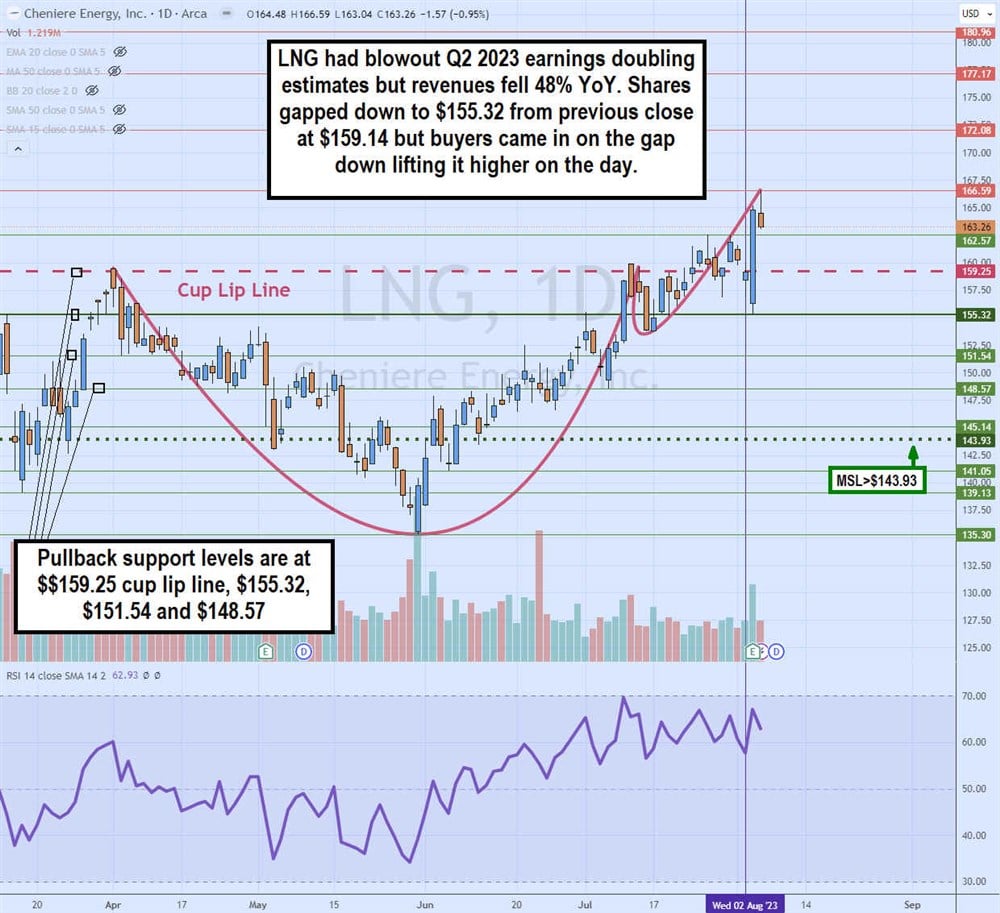
LNG shares sold off from its $159.14 close to a low of $155.32 on the earnings reaction. However, buyers started to come into the stock as the market opened, driving shares to close at $164.83. The daily cup and handle breakout resumed after buyers bought the dip, which held above the handle low.
The daily relative strength index (RSI) has been chopping in the 550-band to 70-band range for weeks and is still in the same range. Pullback support levels are at $159.25 cup lip line, $151.54 and $148.57.
Cars.com Inc. (NASDAQ: CARS)
Here's another company whose stock symbol represents the business. Cars.com is a digital marketplace platform connecting new and used car buyers and sellers. Sellers include individuals, dealers, original equipment manufacturers (OEMs) and automotive retailers.
The company also owns the websites Auto.com, PickupTrucks.com and Newcars.com. The company claims to have invented car search. The company is surprisingly profitable.
Earnings Beat and Raise
On Aug. 3, 2023, Cars.com reported its Q2 2023 EPS of $1.37, crushing 46 cents consensus analyst estimates by a whopping 91 cents. Net income was $94.1 million compared to $5.5 million in the year-ago period. However, a large portion of net income was related to releasing a significant portion of the Company's valuation allowance.
The valuation allowance is a non-cash item. Adjusted EBITDA was $45.6 million or 27% of revenue compared to $27.1 million in the year-ago period.
Website traffic rose 5% YoY to 156 million visits. The average monthly unique visitors was 26.9 million. Dealer customers fell to 18,785 compared to 19.186 in the year-ago period. Dealer revenues rose 6% YoY, driven by the growth from the Marketplace Repackaging Initiative, which was designed to help dealers find the right pricing and value proposition for their needs and retain more dealers.
The company raised its Q3 2023 revenues to $172 to $174 million versus $171.45 million consensus analyst estimates.
Cars.com CEO Alex Vetter commented, "Consumer demand remains strong, and customer engagement with our solutions is also increasing. We believe that our continued efforts to drive digital adoption across our industry will yield increased value to consumers, dealers, and OEMs, as well as growth in Revenue and Adjusted EBITDA this year and beyond."
Cars.com analyst ratings and price targets are at MarketBeat.
Daily Ascending Triangle Breakout
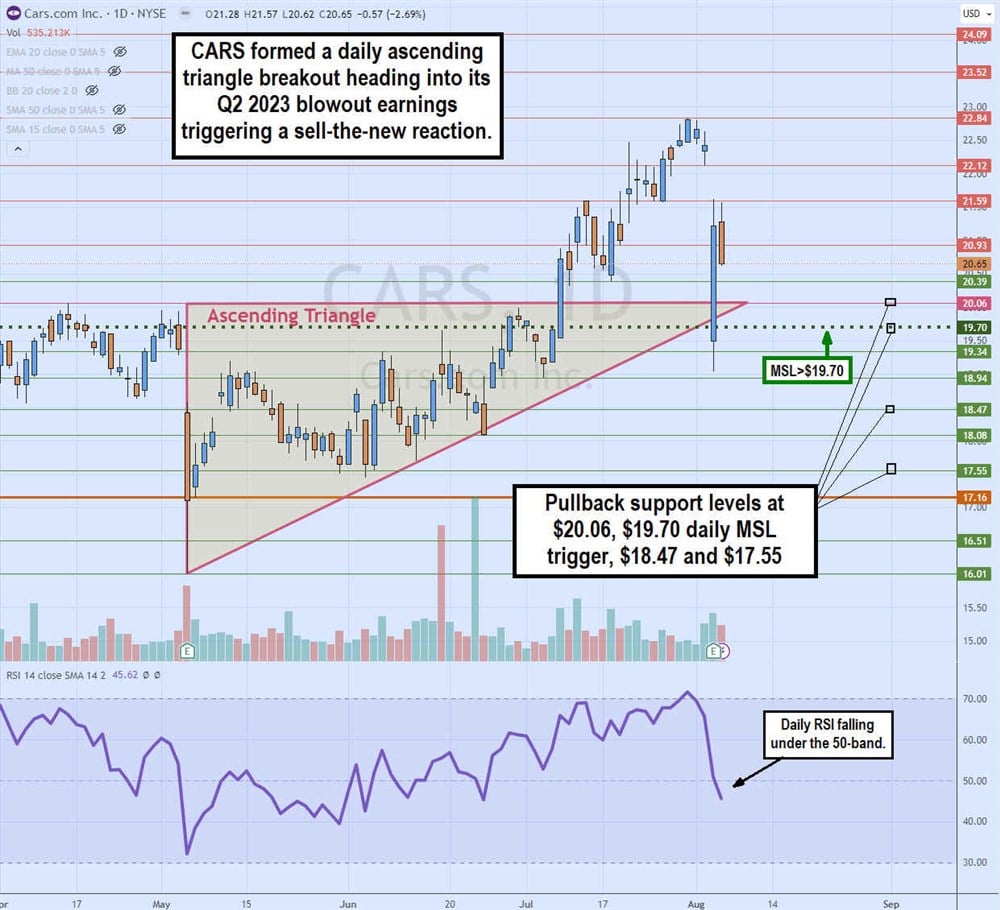
The daily candlestick chart on CARS shows the ascending triangle breakout through the $20.06 flat-top horizontal trendline weeks ahead of the earnings release. Shares started to peak and sell off just before earnings as the stock closed at $22.12 and gapped to $17.16 after hours.
Shares opened at $19.04 and recovered to $21.22 by the close, down 2.69% on the day. The recovery fizzled at $21.59 as the relative strength index (RSI) continued to fall through the 50-band. Pullback support levels are at a $20.06 flat-top trendline, $19.70 daily MSL, $18.47 and $17.55.
More News
View More


Recent Quotes
View More
Quotes delayed at least 20 minutes.
By accessing this page, you agree to the Privacy Policy and Terms Of Service.