Domino’s vs. Papa John's: Stock Showdown of Pizza Giants
The pizza wars pit the 2 major pizza franchises against each other: Domino’s Pizza Inc. (NYSE: DPZ) versus Papa John’s International Inc. (NASDAQ: PZZA). While both brands operate in the retail/wholesale sector and have their fans and critics, one stock is clearly winning this war: Domino's.
Market Divergence: Domino's Surges While Papa John's Struggles
In fact, the trajectory between the 2 stocks couldn't be any more opposite. Domino's stock is trading up 26.5% year-to-date (YTD), while Papa John's is trading down nearly 39% YTD near 52-week lows when the S&P 500 index is trading near all-time highs.
With such a divergence, investors question whether it will continue and which stock presents a better investment opportunity moving forward. Let's examine each stock.
Domino’s: The World's Largest Pizza Company
Domino’s is the world's largest pizza company, operating in over 90 international markets serviced by over 20,500 restaurants. Over 95% of its stores are franchised, which makes Domino’s an asset-light operation. The company caters to budget-conscious consumers, offering numerous promotions, coupons, and a loyalty program accessible through its mobile app. The company is highly technology-oriented, with heavy investments in the mobile app, online ordering, and delivery tracking.
Domino's Q1 2024 EPS Beats Estimates
On April 24, 2024, Domino's reported Q1 2024 EPS of $3.58, beating analyst estimates by 18 cents. Revenues grew 5.9% YoY to $1.08 billion, matching consensus estimates. Global retail sales grew 7.3% YoY. U.S. same-store sales (SSS) grew 5.6% YoY. International sales rose 0.9%. Global net store growth was 164. Its recent partnership with Uber Technologies Inc. (NYSE: UBER) Uber Eats partnership will result in an extra 3% more sales through the channel.
Domino’s Reaffirms Strong 2024 Forecasts
Domino's expects 7% annual global retail sales growth and 8% annual income growth from operations. The company expects to grow its store count by over 1,100 in 2024. U.S. comps are expected to stay above 3% each quarter. Uber Eats sales are expected to increase throughout the year as marketing spend and awareness rise.
Domino’s CEO Russell Weiner commented, "The renowned value we created through our new and improved Domino's Rewards loyalty program drove outsized comp performance, which flowed through to the bottom line with double-digit profit growth. Importantly, our growth in the U.S. came through positive order counts in both our carryout and delivery businesses for the second quarter in a row. Further, this order growth was across all income cohorts.”
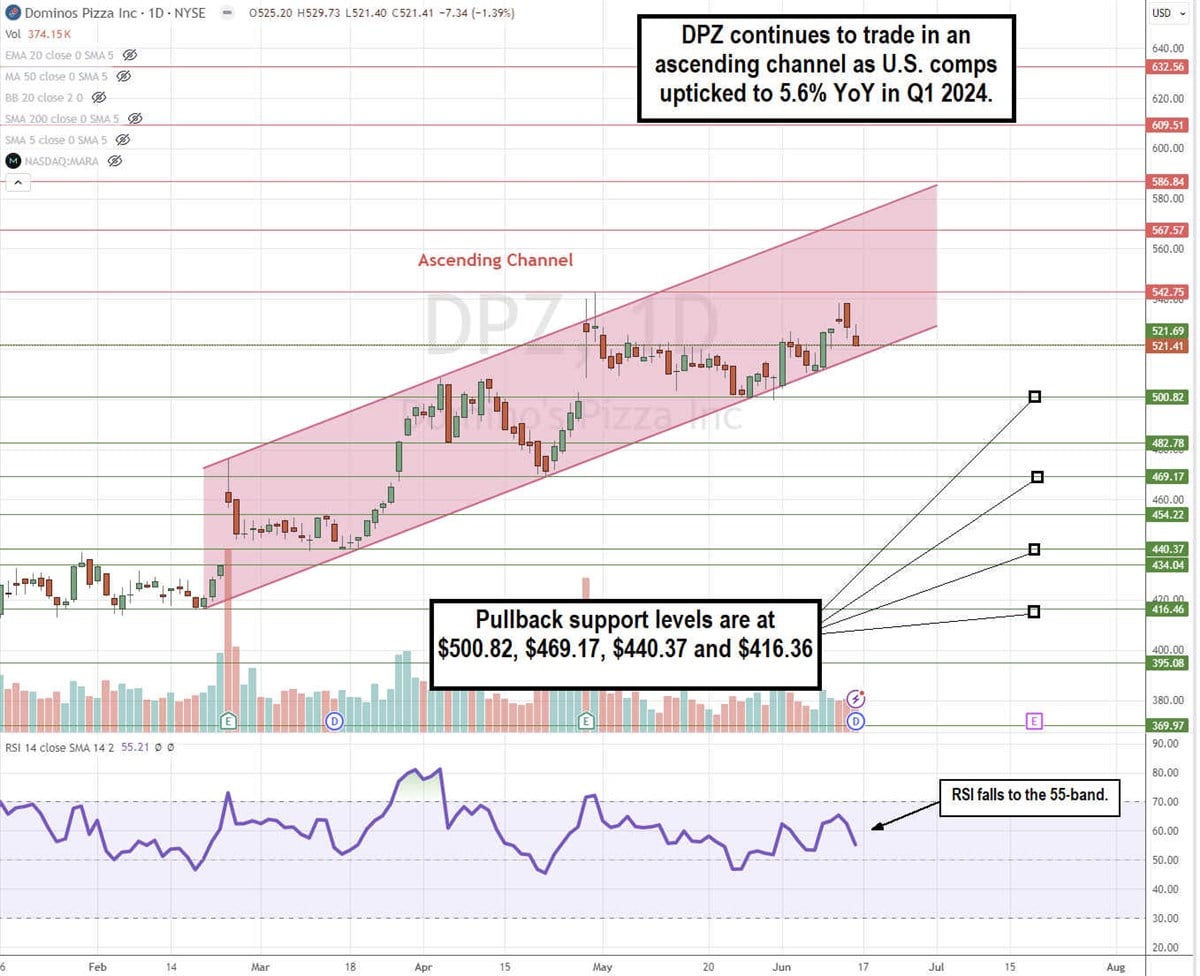
DPZ Stock Continues its Daily Ascending Channel
The daily candlestick chart on DPZ displays an ascending channel comprised of higher highs and higher lows. Shares are trading near the lower trendline as the daily RSI falls to the 55-band. Pullback support levels are at $500.82, $469.17, $440.37, and $416.36.
Domino's Pizza analyst ratings and price targets are on MarketBeat.
Papa John's: Navigating Recovery and Growth Challenges
Papa John's is the fourth-largest pizza operator in the nation. It is still recovering from the many controversies surrounding its founder, John Schnatter, ranging from racial slurs and political comments to sexual harassment allegations and the poison pill adopted by the Board of Directors to prevent Schnatter from ever regaining control of the company. Approximately 91% of its U.S. stores and around 41% of its international stores are franchised. Papa John's focuses on fresh and premium ingredients. The stock is trading near its 52-week lows.
Papa John's Revenues Continue to Fall in Q1 2024
Papa John's reported Q1 2024 EPS of 67 cents, beating analyst estimates by 10 cents. Revenues fell 2.5% YoY to $513.9 million, missing the consensus estimates of $544.46 million. North American comparable sales fell 2% YoY. Domestic company-owned restaurant sales fell 3% YoY. North American franchised restaurant sales fell by 2%. International comparable sales fell 3% YoY. The number of new units in North America rose by 8, and the company expects to open 100 to 140 new restaurants in 2024. Papa John's expects North American comps to remain flat to down low single digits in the full year 2024.
Papa John’s CEO Ravi Thanawala commented, “Our teams are taking a disciplined approach to running the business, improving restaurant-level margins, and increasing operating profits despite a challenging environment in the first quarter.”
Thanawala concluded, “More importantly, we’re making meaningful progress on our Back to Better 2.0 and International Transformation initiatives. The foundational improvements we are implementing in our restaurant operations, digital solutions, and marketing platforms are designed to drive sustainable, profitable growth around the globe.”
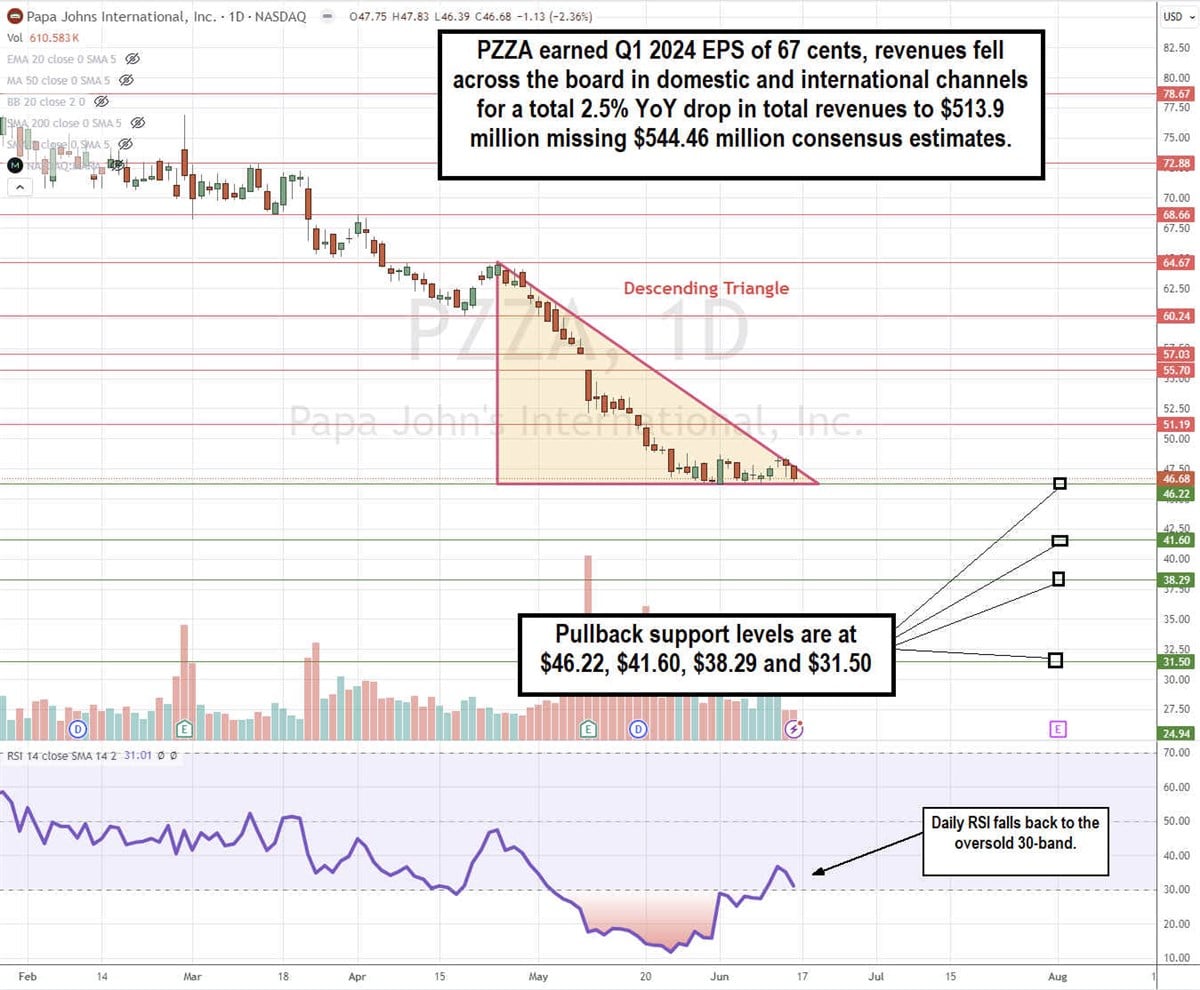
PZZA Stock is in a Descending Triangle Breakdown Pattern
The daily candlestick chart on PZZA illustrates a bearish descending triangle pattern. The descending triangle formed on the lower highs that formed following the $64.67 peak down to the flat-bottom lower trendline support at $46.68. The daily RSI is falling back to the 30-band, indicating a potential breakdown. Pullback support levels are at $46.22, $41.60, $38.29, and $31.50.
Papa John's analyst ratings and price targets are on MarketBeat.
More News
View More


Recent Quotes
View More
Quotes delayed at least 20 minutes.
By accessing this page, you agree to the Privacy Policy and Terms Of Service.