Wynn Resorts: 6 Reasons to Ante Up for the Stock

Luxury casino resorts operator Wynn Resorts Ltd. (NASDAQ: WYNN) shares have fallen 4.7% year-to-date (YTD), trading closer to its 52-week lows at $81.65 than its 52-week highs of $112.25. The artificial intelligence (AI) boom has siphoned the bulk of investor money, leaving fledging casino stocks to severely underperform the S&P 500 index, up 16.69% YTD. However, this negative sentiment can also be seen as an opportunity for prudent investors who can smell a bargain. Here are six reasons to consider buying WYNN shares while they’re down.
Wynn Resorts operates in the consumer discretionary sector, competing against casino operators like MGM Resorts International (NYSE: MGM), with 13 properties in Las Vegas, Caesar’s Entertainment Inc. (NASDAQ: CZR), and Las Vegas Sands Co. (NYSE: LVS), which incidentally no longer operates any Las Vegas casinos but has integrated resorts in Macao and Singapore.
1) Tropicana and Mirage Closures in Las Vegas Results in 5% Less Room Capacity
Competition on the Las Vegas Strip may be loosening up in the near term as two iconic casino properties close. The 70-year-old Tropicana Las Vegas closed permanently on April 2, 2024, and a 30,000-seat stadium for the Oakland Athletics baseball team will be built in its stead.
The 34-year-old and 65-acre Mirage Hotel & Casino is set to close on July 17, 2024, and undergo reconstruction to re-open as the Hard Rock Hotel & Casino and Guitar Hotel in 2027. Together, both properties account for nearly 5% of the rooms on the Las Vegas Strip. This shortfall will naturally result in additional capacity demand for existing hotels, including The Wynn.
2) Normalization Continues in Las Vegas
Investor sentiment remains low for the Las Vegas strip due to rising labor costs and macroeconomic uncertainty. Average daily room rates continue to rise. There is still room to grow as occupancy hasn't yet recovered to 2019 pre-pandemic levels. The travel boom and consumer spending on services and experiences remain high, coupled with a strong event and convention business and international demand, all point to continued recovery. The Nevada Gaming Board reported a May gaming win rate of 2.45% YoY growth to $1.32 billion. The Last Vegas Strip saw a 3.7% YoY win to $742.5 million.
3) Macau Continues to Recover
Macau is currently the undisputed gambling capital of the world, and it continues to recover since COVID-related travel restrictions were lifted entirely by the beginning of 2023. Macau Gaming Inspection and Coordination Bureau reported that in May 2024, gross revenues rose 16.4% YoY to $2.5 billion. Comps were tough compared to the 336% YoY increase in May 2023. While June's gross gaming revenue (GGR) was the lowest of 2024, the decline was primarily due to seasonality and the UEFA Euro 2024 soccer tournament, resulting in a low VIP hold rate. For the six months of 2024, Macau GGR was up 41.9% YoY, and running at 74% of its 2019 pre-pandemic level.
4) The United Arab Emirates Could be the Next Macau
Wynn Resorts is proceeding with its plans to open a hotel-casino in the emirate of Ras Al Khaimah in the United Arab Emirates (UAE). Gambling is currently illegal in the UAE; however, that long-lasting ban is seeing some softening. The construction of the Wynn Al Marjan island is progressing. Wynn partnered with Marjan and RAK Hospitality Holdings. This has caused a buying frenzy of available land on Al Marjan Island, which has set off plans for a central business and beach district.
CBRE Equity Research sees a GGR of $1.38 billion, net revenue of $1.8 billion, and property EBITDARM of $921 million for Wynn Al Marjan Island. They estimate property margin to be in the mid-30 % range, but margins can rise to 50% due to low tax rates, an operator-friendly regulatory regime, and almost no competition.
5) Analysts Rate WYNN Shares a Buy
Wynn reported Q1 2024 EPS of $1.59, beating consensus estimates by 30 cents. Revenues surged 30.9% YoY to $1.86 billion, beating $1.8 billion consensus estimates. It's no wonder that analysts upgraded shares after the results.
The average rating on WYNN stock is a moderate buy based on f 13 analysts. On May 23, 2024, Argus upgraded shares of WYNN to a Buy from Hold with a $110 price target. On May 24, 2024, Seaport Research Partners raised their rating to a Buy from Neutral with a $116 price target. Wynn Resorts analyst forecasts and price targets can be found at MarketBeat. The consensus analyst price target points to a 39.5% upside at $121.15.
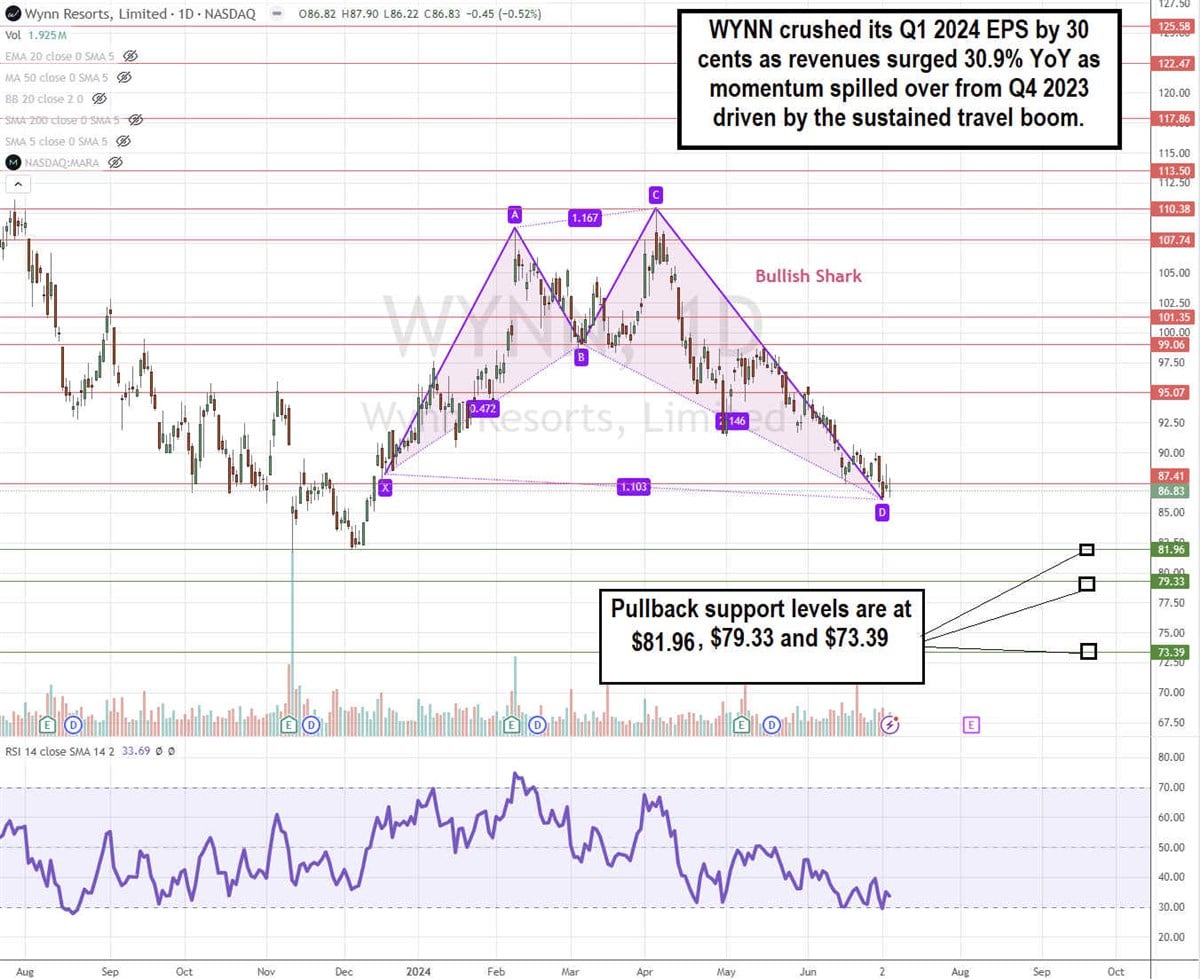
6) WYNN Stock is Forming a Rare Bullish Shark Pattern
The daily candlestick chart on WYNN may be setting up for a harmonic pattern called a bullish shark. This pattern is comprised of a first peak (A) followed by a pullback to point B and a bounce to a second higher peak (C) that is 1.13 or 113% to 1.618 or 116% the height of the first peak A. The sell-off to point D should be a 1.618 to 2.24 ratio of the distance between point B and point C. Upside targets are a rebound back to point B at $99.06 with the potential to peak C at $110.38. The relative strength index (RSI) has been chopping but holding above the 30-band and a bounce through the 40-band could form a divergence bottom. Pullback support levels are at $81.96, $79.33, and $73.39.
More News
View More


Recent Quotes
View More
Quotes delayed at least 20 minutes.
By accessing this page, you agree to the Privacy Policy and Terms Of Service.