Tempur Sealy (NYSE:TPX) Surprises With Q3 Sales

Bedding manufacturer Tempur Sealy (NYSE: TPX) met Wall Street’s revenue expectations in Q3 CY2024, with sales up 1.8% year on year to $1.3 billion. Its non-GAAP profit of $0.82 per share was 1.6% above analysts’ consensus estimates.
Is now the time to buy Tempur Sealy? Find out by accessing our full research report, it’s free.
Tempur Sealy (TPX) Q3 CY2024 Highlights:
- Revenue: $1.3 billion vs analyst estimates of $1.29 billion (in line)
- Adjusted EPS: $0.82 vs analyst estimates of $0.81 (1.6% beat)
- EBITDA: $274.8 million vs analyst estimates of $280.6 million (2.1% miss)
- Management lowered its full-year Adjusted EPS guidance to $2.50 at the midpoint, a 2% decrease
- Gross Margin (GAAP): 45.4%, in line with the same quarter last year
- Operating Margin: 15.5%, up from 14.3% in the same quarter last year
- EBITDA Margin: 21.1%, in line with the same quarter last year
- Free Cash Flow Margin: 18.5%, up from 14.7% in the same quarter last year
- Market Capitalization: $8.66 billion
Company Chairman and CEO Scott Thompson commented, "We are pleased with our performance in the third quarter. Our global market outperformance, led by double-digit growth in our international segment, resulted in consolidated sales growth year-over-year despite the global bedding industry continuing to perform significantly below historical trends. Sales growth coupled with our operational efficiency initiatives and diverse business platform resulted in solid growth in both adjusted EBITDA and adjusted EPS. We continue to see our investments in product, people, and advertising as foundational to our long-term success."
Company Overview
Established through the merger of Tempur-Pedic and Sealy in 2012, Tempur Sealy (NYSE: TPX) is a bedding manufacturer known for its innovative memory foam mattresses and sleep products
Home Furnishings
A healthy housing market is good for furniture demand as more consumers are buying, renting, moving, and renovating. On the other hand, periods of economic weakness or high interest rates discourage home sales and can squelch demand. In addition, home furnishing companies must contend with shifting consumer preferences such as the growing propensity to buy goods online, including big things like mattresses and sofas that were once thought to be immune from e-commerce competition.
Sales Growth
A company’s long-term performance is an indicator of its overall business quality. While any business can experience short-term success, top-performing ones enjoy sustained growth for multiple years. Over the last five years, Tempur Sealy grew its sales at a tepid 10.9% compounded annual growth rate. This shows it failed to expand in any major way, a rough starting point for our analysis.
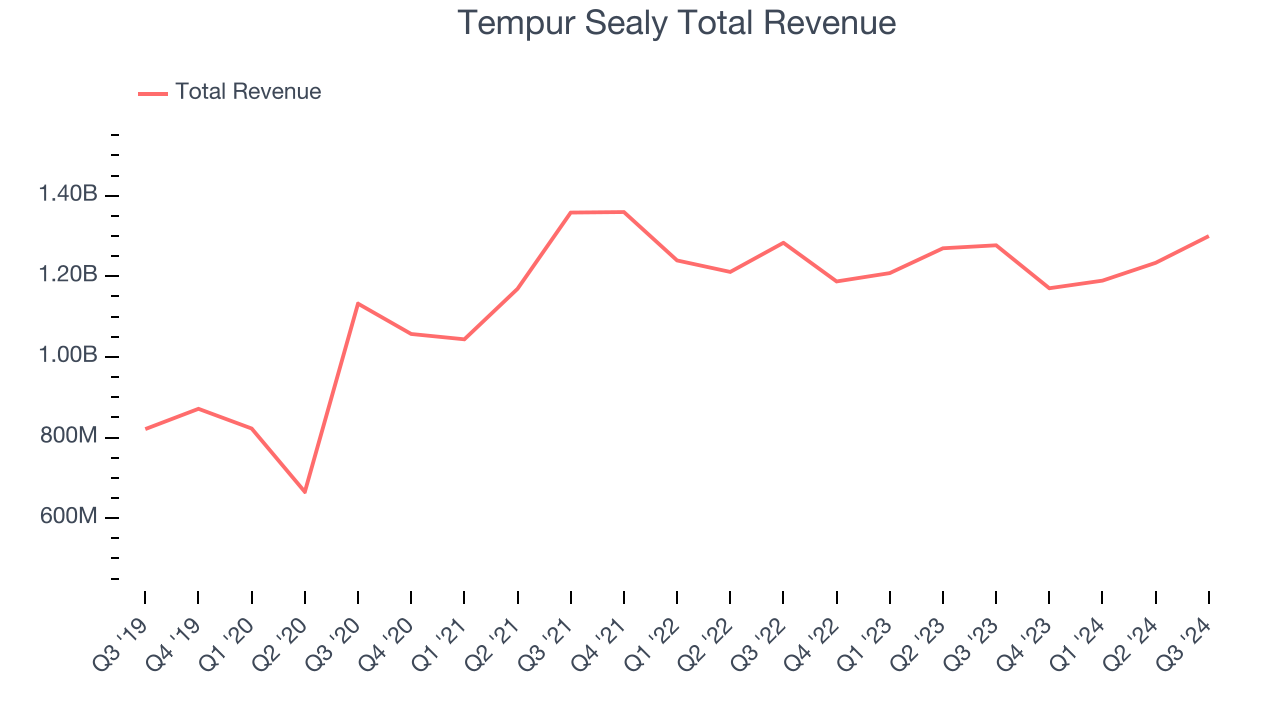
Long-term growth is the most important, but within consumer discretionary, product cycles are short and revenue can be hit-driven due to rapidly changing trends and consumer preferences. Tempur Sealy’s history shows it grew in the past but relinquished its gains over the last two years, as its revenue fell by 2% annually. 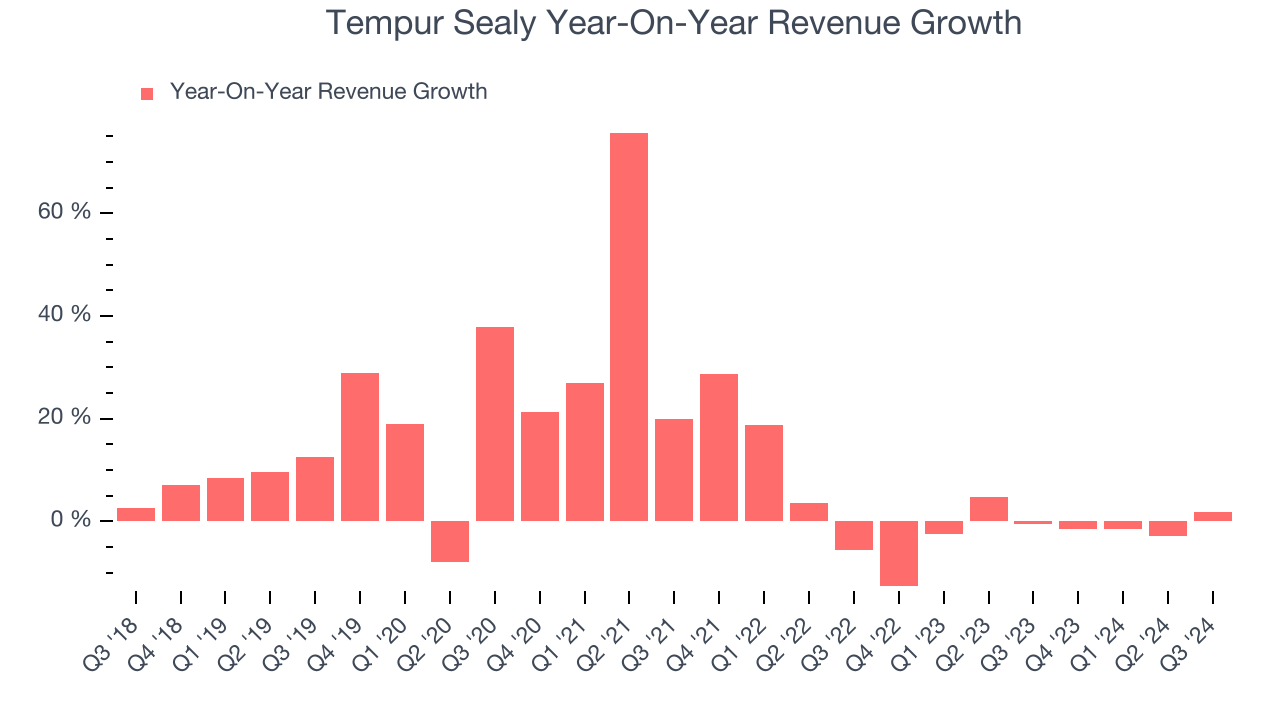
We can dig further into the company’s revenue dynamics by analyzing its most important segments, Wholesale and Direct, which are 75.5% and 24.5% of revenue. Over the last two years, Tempur Sealy’s Wholesale revenue (sales to retailers) averaged 2.8% year-on-year declines. On the other hand, its Direct revenue (sales made directly to consumers) averaged 1.4% growth.
This quarter, Tempur Sealy grew its revenue by 1.8% year on year, and its $1.3 billion of revenue was in line with Wall Street’s estimates.
Looking ahead, sell-side analysts expect revenue to grow 3.6% over the next 12 months, an improvement versus the last two years. Although this projection illustrates the market thinks its newer products and services will spur better performance, it is still below average for the sector.
Unless you’ve been living under a rock, it should be obvious by now that generative AI is going to have a huge impact on how large corporations do business. While Nvidia and AMD are trading close to all-time highs, we prefer a lesser-known (but still profitable) semiconductor stock benefitting from the rise of AI. Click here to access our free report on our favorite semiconductor growth story.
Cash Is King
If you’ve followed StockStory for a while, you know we emphasize free cash flow. Why, you ask? We believe that in the end, cash is king, and you can’t use accounting profits to pay the bills.
Tempur Sealy has shown mediocre cash profitability over the last two years, giving the company limited opportunities to return capital to shareholders. Its free cash flow margin averaged 8.6%, subpar for a consumer discretionary business.
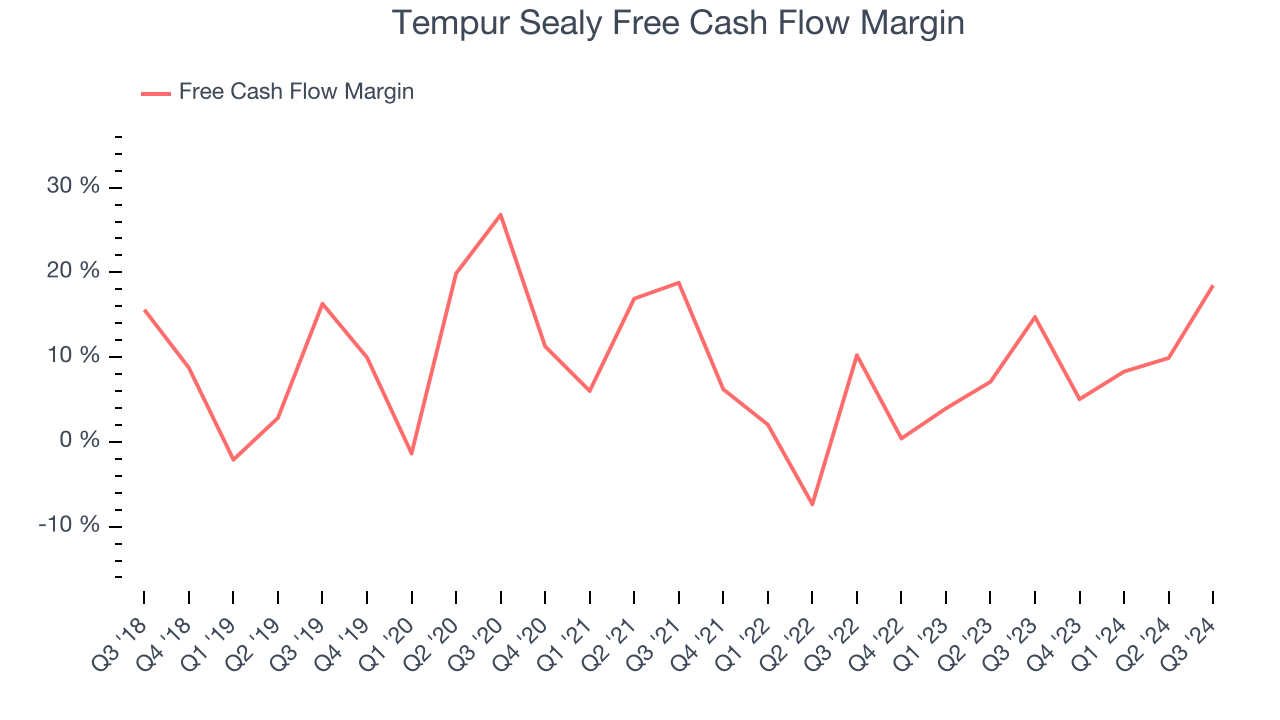
Tempur Sealy’s free cash flow clocked in at $240.2 million in Q3, equivalent to a 18.5% margin. This result was good as its margin was 3.7 percentage points higher than in the same quarter last year, but we wouldn’t read too much into the short term because investment needs can be seasonal, leading to temporary swings. Long-term trends carry greater meaning.
Over the next year, analysts predict Tempur Sealy’s cash conversion will slightly improve. Their consensus estimates imply its free cash flow margin of 10.6% for the last 12 months will increase to 11.9%, it options for capital deployment (investments, share buybacks, etc.).
Key Takeaways from Tempur Sealy’s Q3 Results
It was encouraging to see Tempur Sealy narrowly top analysts’ revenue and EPS expectations this quarter. Operating margin also rose year on year. This was a decent result, especially considering a number of stocks tied to residential housing saw weak results this quarter. The stock traded up 3.2% to $51.49 immediately after reporting.
Big picture, is Tempur Sealy a buy here and now? We think that the latest quarter is only one piece of the longer-term business quality puzzle. Quality, when combined with valuation, can help determine if the stock is a buy. We cover that in our actionable full research report which you can read here, it’s free.
More News
View More


Recent Quotes
View More
Quotes delayed at least 20 minutes.
By accessing this page, you agree to the Privacy Policy and Terms Of Service.