Travel + Leisure’s (NYSE:TNL) Q1 Earnings Results: Revenue In Line With Expectations

Hospitality company Travel + Leisure (NYSE: TNL) met Wall Street’s revenue expectations in Q1 CY2025, with sales up 2% year on year to $934 million. Its non-GAAP profit of $1.11 per share was 1.5% below analysts’ consensus estimates.
Is now the time to buy Travel + Leisure? Find out by accessing our full research report, it’s free.
Travel + Leisure (TNL) Q1 CY2025 Highlights:
- Revenue: $934 million vs analyst estimates of $930 million (2% year-on-year growth, in line)
- Adjusted EPS: $1.11 vs analyst expectations of $1.13 (1.5% miss)
- Adjusted EBITDA: $202 million vs analyst estimates of $200.1 million (21.6% margin, 0.9% beat)
- EBITDA guidance for the full year is $970 million at the midpoint, in line with analyst expectations
- Operating Margin: 16.7%, in line with the same quarter last year
- Free Cash Flow Margin: 10.7%, up from 3.3% in the same quarter last year
- Tours Conducted: 153,000, down 2,000 year on year
- Market Capitalization: $2.84 billion
Company Overview
Formerly known as Wyndham Destinations, Travel + Leisure (NYSE: TNL) is a global vacation company that provides travelers with vacation ownership, exchange, and travel services.
Travel and Vacation Providers
Airlines, hotels, resorts, and cruise line companies often sell experiences rather than tangible products, and in the last decade-plus, consumers have slowly shifted from buying "things" (wasteful) to buying "experiences" (memorable). In addition, the internet has introduced new ways of approaching leisure and lodging such as booking homes and longer-term accommodations. Traditional airlines, hotel, resorts, and cruise line companies must innovate to stay relevant in a market rife with innovation.
Sales Growth
A company’s long-term sales performance is one signal of its overall quality. Any business can put up a good quarter or two, but the best consistently grow over the long haul. Unfortunately, Travel + Leisure’s 1.1% annualized revenue growth over the last five years was weak. This fell short of our benchmarks and is a tough starting point for our analysis.
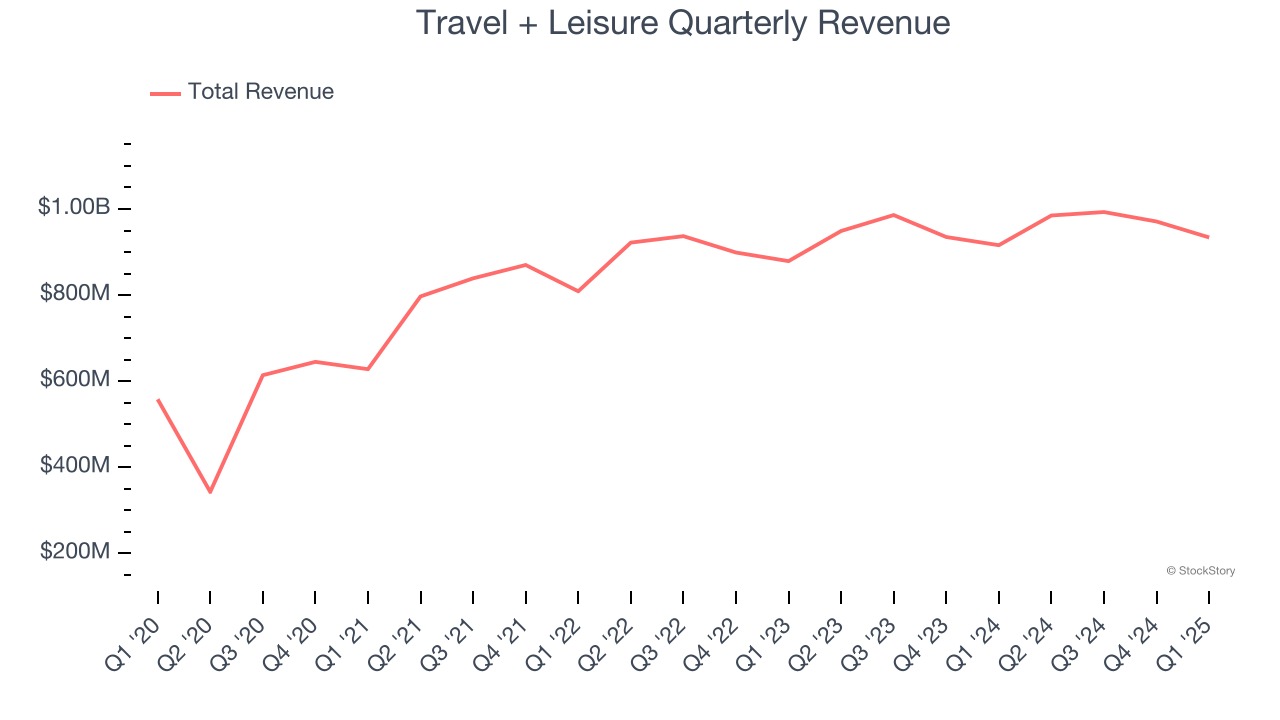
We at StockStory place the most emphasis on long-term growth, but within consumer discretionary, a stretched historical view may miss a company riding a successful new property or trend. Travel + Leisure’s annualized revenue growth of 3.3% over the last two years is above its five-year trend, but we were still disappointed by the results. 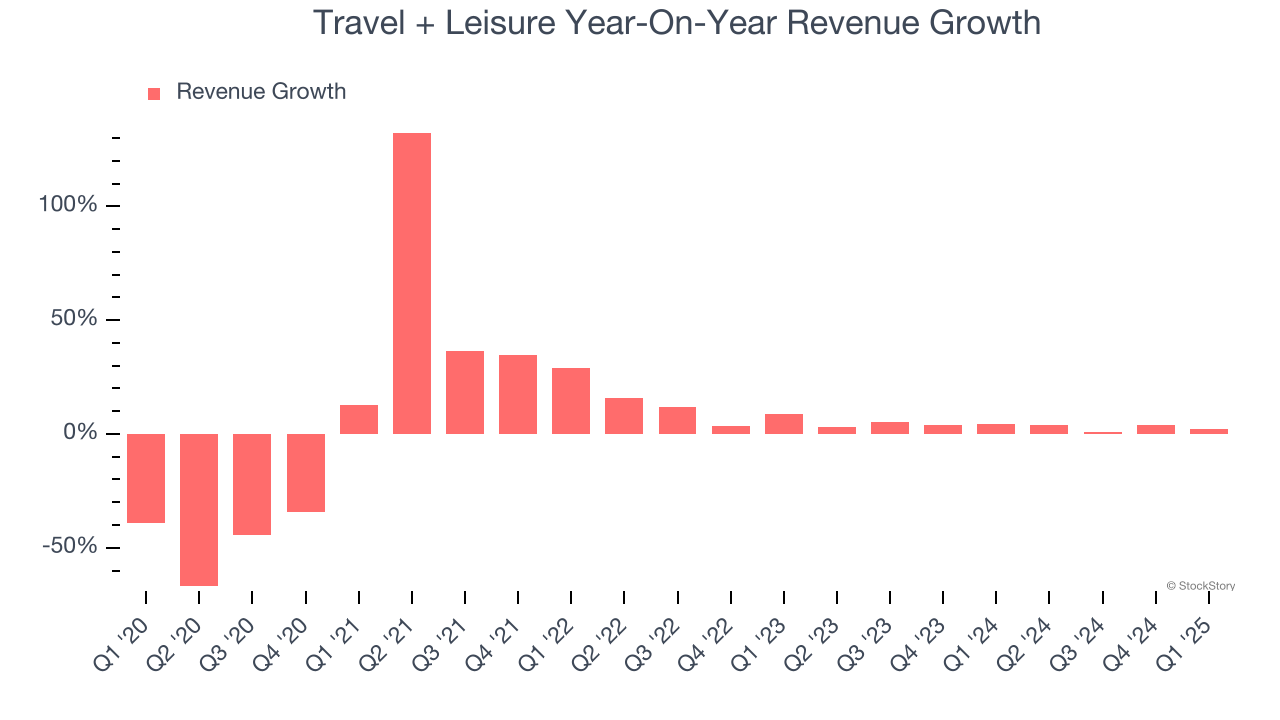
Travel + Leisure also discloses its number of tours conducted, which reached 153,000 in the latest quarter. Over the last two years, Travel + Leisure’s tours conducted averaged 10.3% year-on-year growth. Because this number is higher than its revenue growth during the same period, we can see the company’s monetization has fallen. 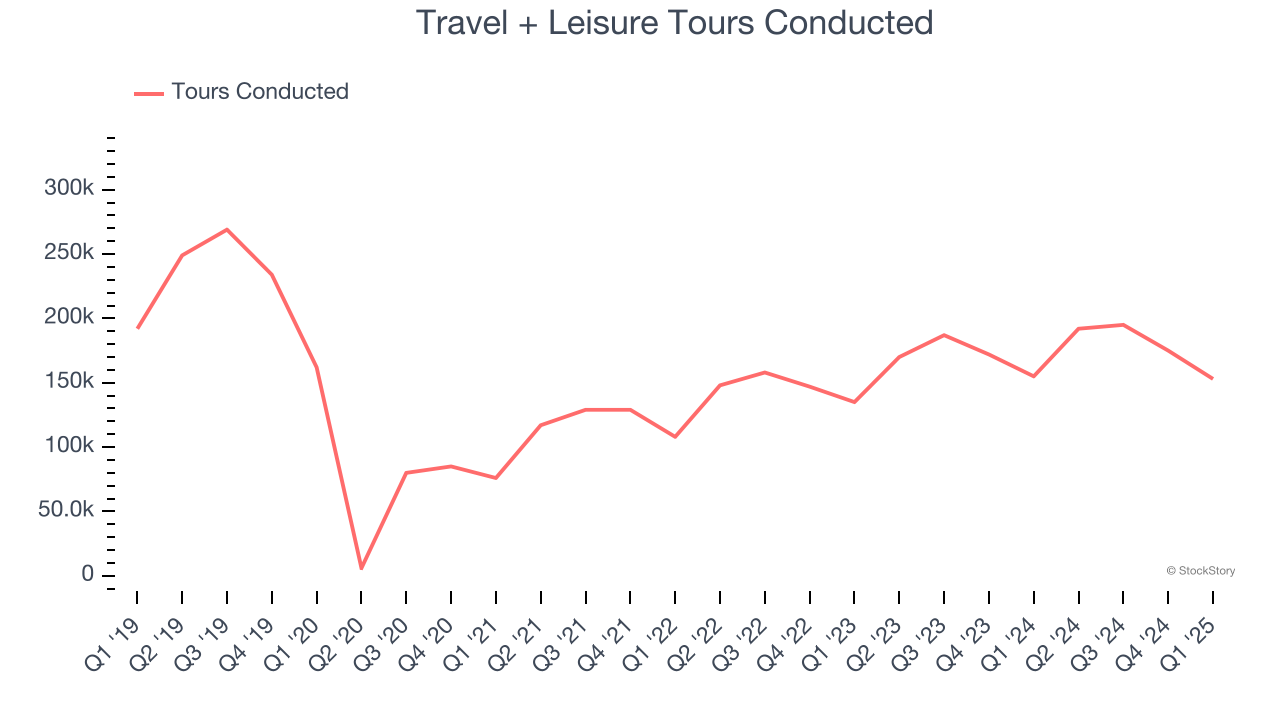
This quarter, Travel + Leisure grew its revenue by 2% year on year, and its $934 million of revenue was in line with Wall Street’s estimates.
Looking ahead, sell-side analysts expect revenue to grow 3.9% over the next 12 months, similar to its two-year rate. This projection is underwhelming and suggests its newer products and services will not catalyze better top-line performance yet.
Software is eating the world and there is virtually no industry left that has been untouched by it. That drives increasing demand for tools helping software developers do their jobs, whether it be monitoring critical cloud infrastructure, integrating audio and video functionality, or ensuring smooth content streaming. Click here to access a free report on our 3 favorite stocks to play this generational megatrend.
Operating Margin
Travel + Leisure’s operating margin might fluctuated slightly over the last 12 months but has generally stayed the same, averaging 19.2% over the last two years. This profitability was top-notch for a consumer discretionary business, showing it’s an well-run company with an efficient cost structure.
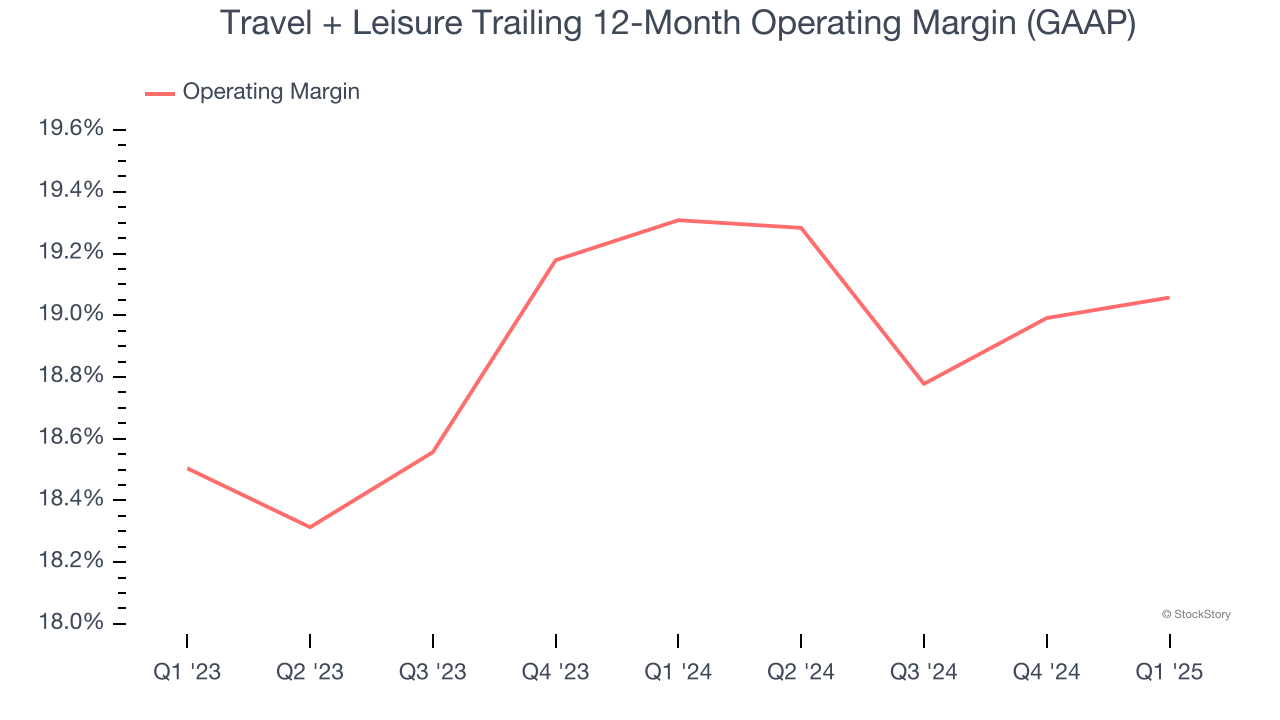
This quarter, Travel + Leisure generated an operating profit margin of 16.7%, in line with the same quarter last year. This indicates the company’s overall cost structure has been relatively stable.
Earnings Per Share
Revenue trends explain a company’s historical growth, but the long-term change in earnings per share (EPS) points to the profitability of that growth – for example, a company could inflate its sales through excessive spending on advertising and promotions.
Travel + Leisure’s EPS grew at a decent 10.4% compounded annual growth rate over the last five years, higher than its 1.1% annualized revenue growth. This tells us the company became more profitable on a per-share basis as it expanded.
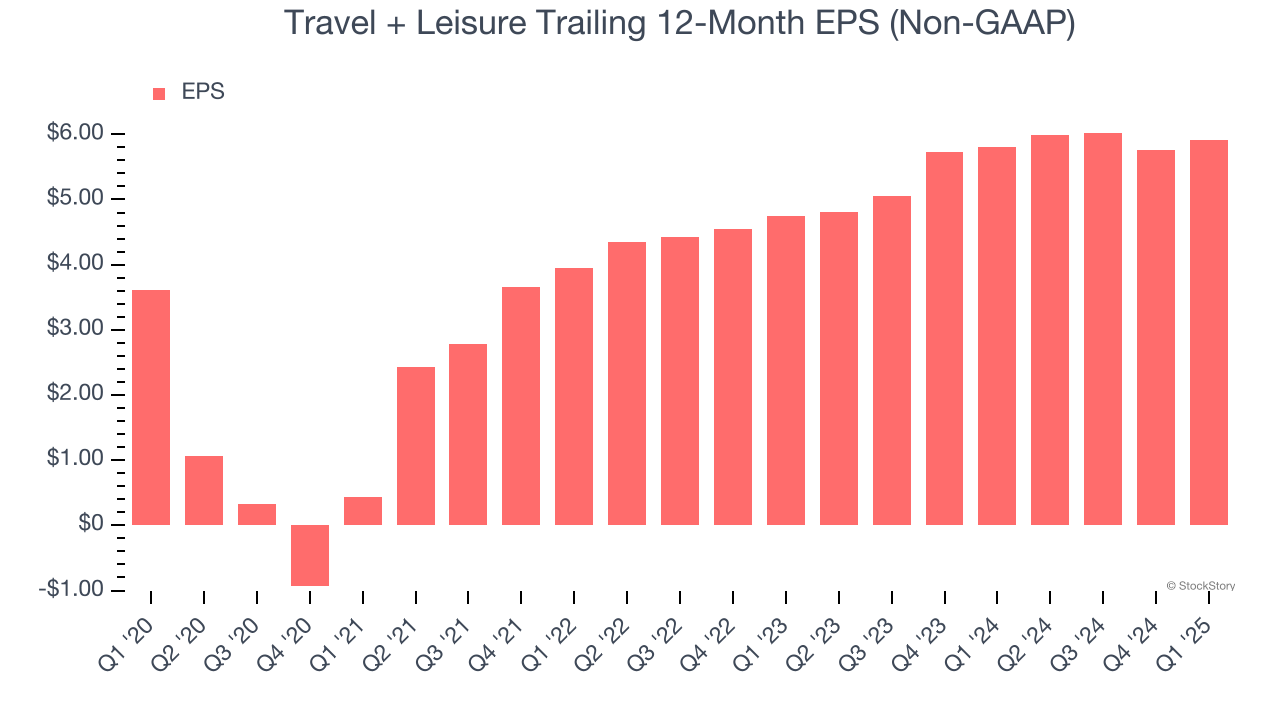
In Q1, Travel + Leisure reported EPS at $1.11, up from $0.96 in the same quarter last year. Despite growing year on year, this print slightly missed analysts’ estimates, but we care more about long-term EPS growth than short-term movements. Over the next 12 months, Wall Street expects Travel + Leisure’s full-year EPS of $5.92 to grow 12.5%.
Key Takeaways from Travel + Leisure’s Q1 Results
We struggled to find many positives in these results. Its number of tours conducted missed and its EPS fell slightly short of Wall Street’s estimates. Overall, this quarter could have been better. The stock traded down 5% to $40.51 immediately after reporting.
Big picture, is Travel + Leisure a buy here and now? The latest quarter does matter, but not nearly as much as longer-term fundamentals and valuation, when deciding if the stock is a buy. We cover that in our actionable full research report which you can read here, it’s free.
More News
View More


Recent Quotes
View More
Quotes delayed at least 20 minutes.
By accessing this page, you agree to the Privacy Policy and Terms Of Service.