Wyndham’s (NYSE:WH) Q1 Earnings Results: Revenue In Line With Expectations

Hotel franchising company Wyndham (NYSE: WH) met Wall Street’s revenue expectations in Q1 CY2025, with sales up 3.6% year on year to $316 million. Its non-GAAP profit of $0.86 per share was 5.6% above analysts’ consensus estimates.
Is now the time to buy Wyndham? Find out by accessing our full research report, it’s free.
Wyndham (WH) Q1 CY2025 Highlights:
- Revenue: $316 million vs analyst estimates of $316 million (3.6% year-on-year growth, in line)
- Adjusted EPS: $0.86 vs analyst estimates of $0.81 (5.6% beat)
- Adjusted EBITDA: $145 million vs analyst estimates of $148.9 million (45.9% margin, 2.6% miss)
- Management lowered its full-year Adjusted EPS guidance to $4.66 at the midpoint, a 1.4% decrease
- EBITDA guidance for the full year is $737.5 million at the midpoint, in line with analyst expectations
- Operating Margin: 35.4%, up from 16.4% in the same quarter last year
- Free Cash Flow Margin: 16.5%, down from 22% in the same quarter last year
- RevPAR: $36.13 at quarter end, in line with the same quarter last year
- Market Capitalization: $6.67 billion
"We delivered a solid start to the year with strong system growth, record first-quarter openings and continued expansion across every region," said Geoff Ballotti, President and CEO.
Company Overview
Established in 1981, Wyndham (NYSE: WH) is a global hotel franchising company with over 9,000 hotels across nearly 95 countries on six continents.
Sales Growth
Reviewing a company’s long-term sales performance reveals insights into its quality. Any business can put up a good quarter or two, but the best consistently grow over the long haul. Wyndham’s demand was weak over the last five years as its sales fell at a 6.6% annual rate. This wasn’t a great result and is a sign of lacking business quality.
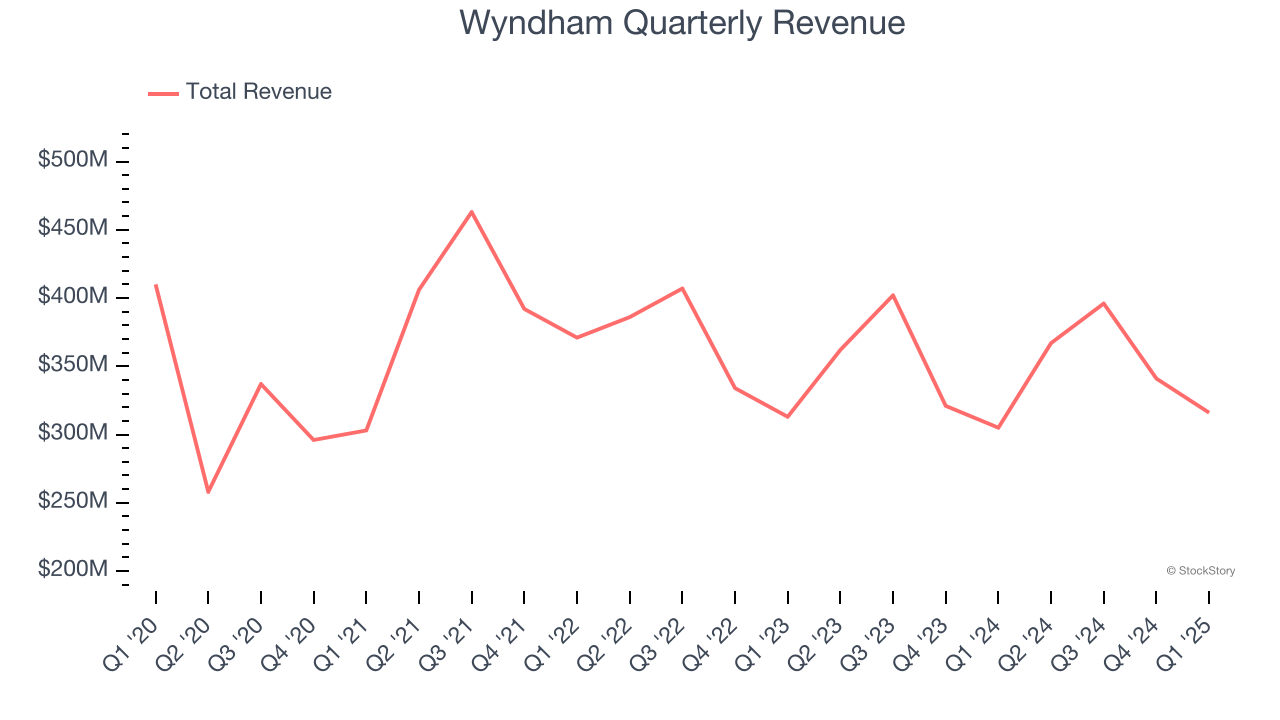
We at StockStory place the most emphasis on long-term growth, but within consumer discretionary, a stretched historical view may miss a company riding a successful new property or trend. Wyndham’s revenue over the last two years was flat, sugggesting its demand was weak but stabilized after its initial drop in sales. 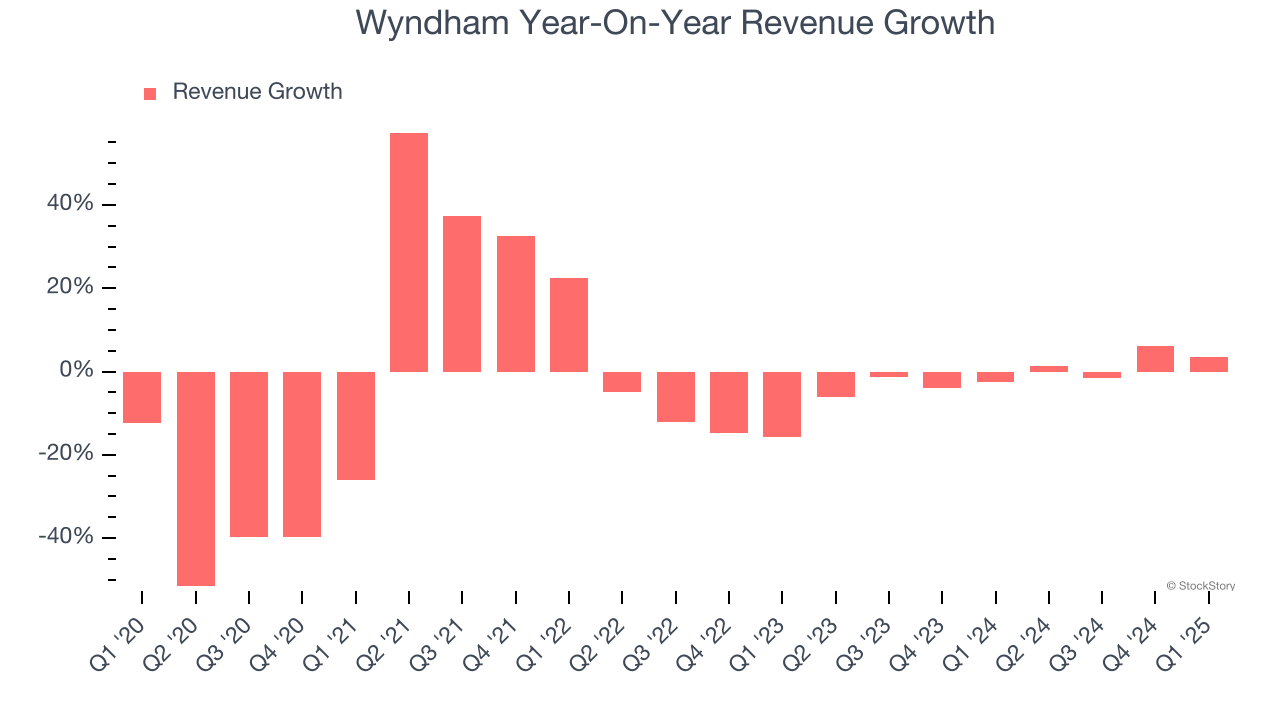
We can better understand the company’s revenue dynamics by analyzing its revenue per available room, which clocked in at $36.13 this quarter and is a key metric accounting for daily rates and occupancy levels. Over the last two years, Wyndham’s revenue per room was flat. This number doesn’t surprise us as it’s in line with its revenue growth. 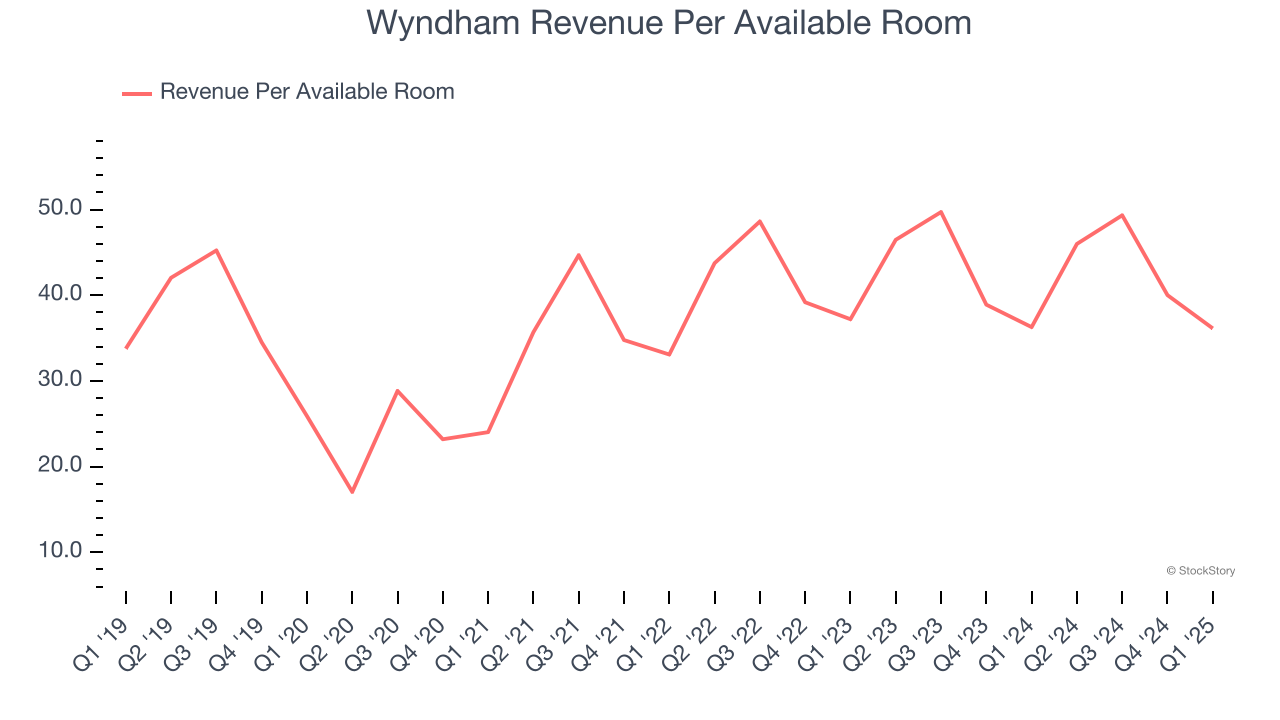
This quarter, Wyndham grew its revenue by 3.6% year on year, and its $316 million of revenue was in line with Wall Street’s estimates.
Looking ahead, sell-side analysts expect revenue to grow 6.6% over the next 12 months. While this projection suggests its newer products and services will fuel better top-line performance, it is still below average for the sector.
Unless you’ve been living under a rock, it should be obvious by now that generative AI is going to have a huge impact on how large corporations do business. While Nvidia and AMD are trading close to all-time highs, we prefer a lesser-known (but still profitable) stock benefiting from the rise of AI. Click here to access our free report one of our favorites growth stories.
Operating Margin
Wyndham’s operating margin has been trending up over the last 12 months and averaged 35.5% over the last two years. On top of that, its profitability was elite for a consumer discretionary business thanks to its efficient cost structure and economies of scale.
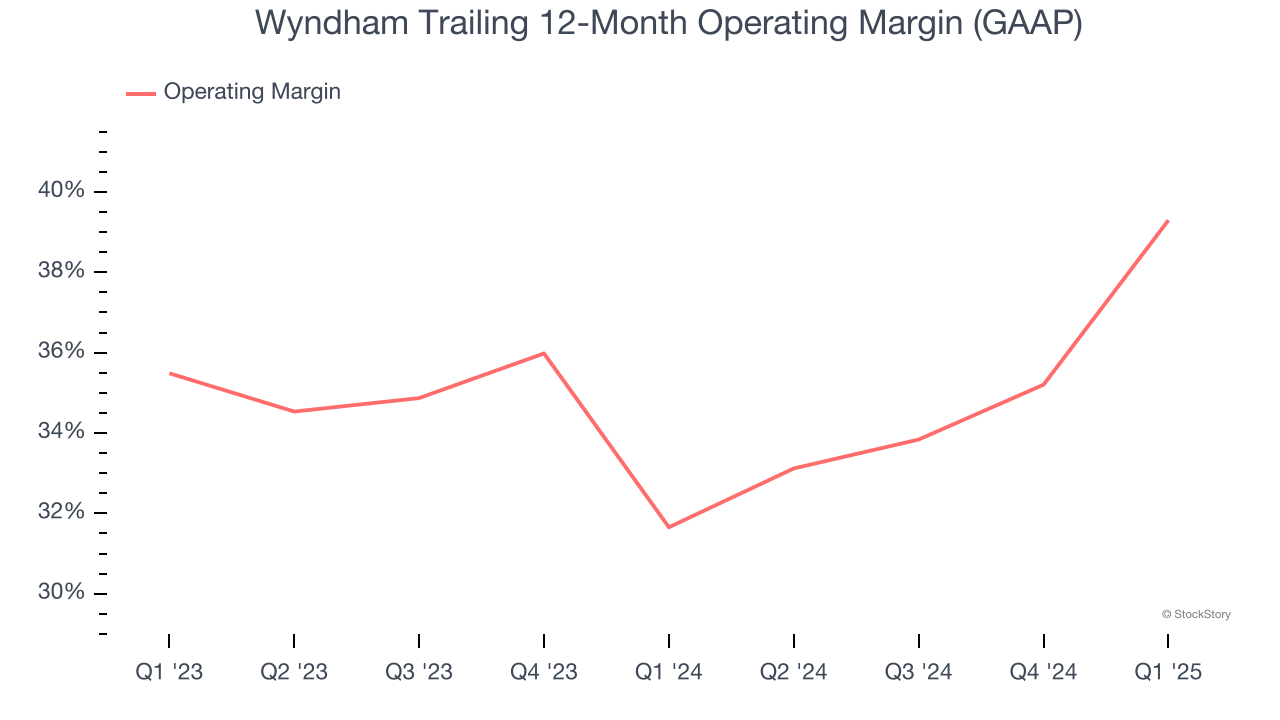
This quarter, Wyndham generated an operating profit margin of 35.4%, up 19 percentage points year on year. This increase was a welcome development and shows it was more efficient.
Earnings Per Share
We track the long-term change in earnings per share (EPS) for the same reason as long-term revenue growth. Compared to revenue, however, EPS highlights whether a company’s growth is profitable.
Wyndham’s EPS grew at an unimpressive 6.3% compounded annual growth rate over the last five years. On the bright side, this performance was better than its 6.6% annualized revenue declines and tells us management adapted its cost structure in response to a challenging demand environment.
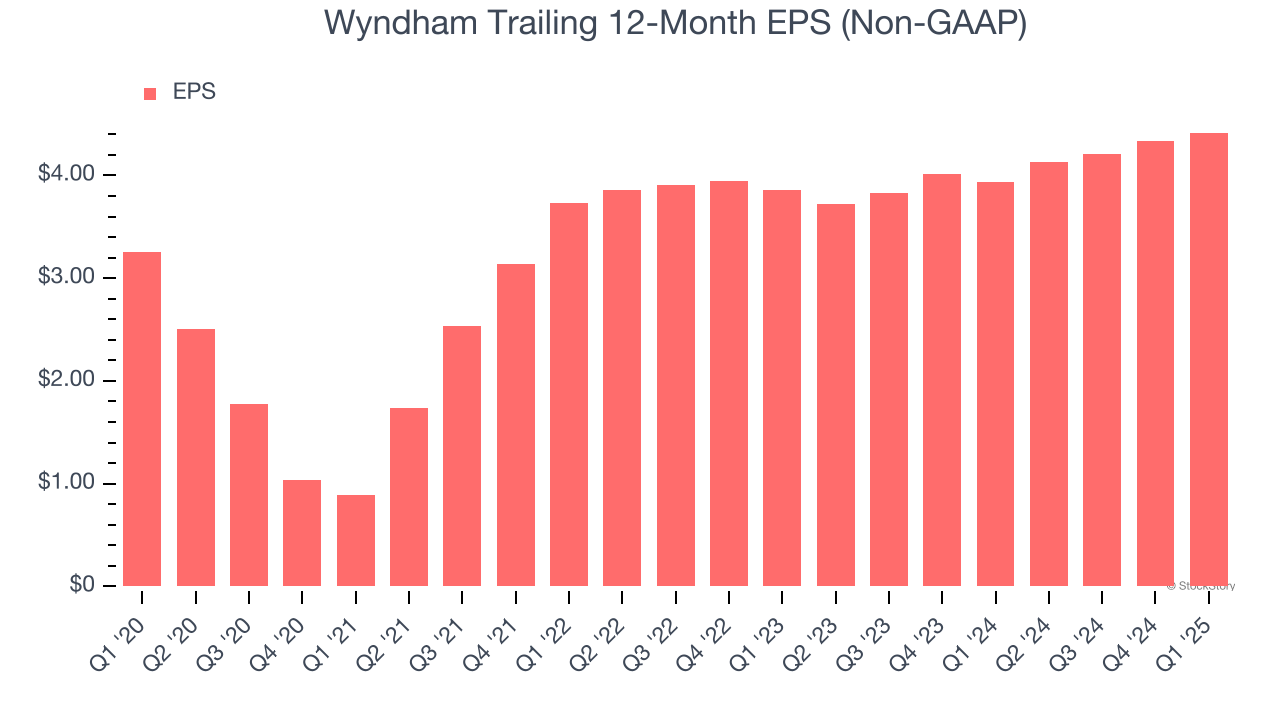
In Q1, Wyndham reported EPS at $0.86, up from $0.78 in the same quarter last year. This print beat analysts’ estimates by 5.6%. Over the next 12 months, Wall Street expects Wyndham’s full-year EPS of $4.42 to grow 12.3%.
Key Takeaways from Wyndham’s Q1 Results
It was encouraging to see Wyndham beat analysts’ EPS expectations this quarter. On the other hand, its EBITDA missed and it lowered its full-year EPS guidance. Zooming out, we think this was a mixed quarter. The market seemed to focus on the negatives, and the stock traded down 1.8% to $83.50 immediately after reporting.
Is Wyndham an attractive investment opportunity right now? What happened in the latest quarter matters, but not as much as longer-term business quality and valuation, when deciding whether to invest in this stock. We cover that in our actionable full research report which you can read here, it’s free.
More News
View More


Recent Quotes
View More
Quotes delayed at least 20 minutes.
By accessing this page, you agree to the Privacy Policy and Terms Of Service.